MicroStrategy ONE
Viewing and interacting with Microcharts widgets: operation modes
Users can view and interact with a Microcharts widget in several ways, known as operation modes. Each of these modes provides the user with a unique way of analyzing the microcharts and data within the widget.
These modes include the following:
-
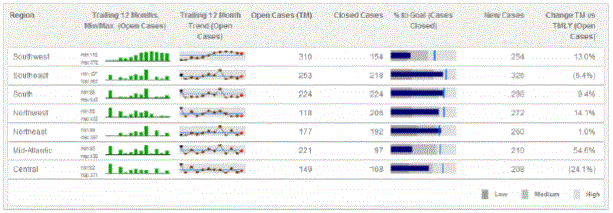
Grid: This is the default operation mode for a Microcharts widget. In this mode, all the rows of microcharts are displayed at the same time, from top to bottom, as shown below:

-
While in Grid mode, if the rows of the Grid/Graph have at least three attributes, each attribute except the right-most attribute is combined and displayed as a row in the widget. For example, if Region is the first attribute and Call Center is the second attribute, rows are displayed for Northeast Boston and Northeast New York.
-
You can specify that the widget groups and indents these rows in a hierarchical tree display. The groups can then be collapsed or expanded to show different levels of detail, with each level representing a different attribute. For an example, and steps to enable tree display, see Enabling Grid mode to view rows in a tree.
-
Vertical Scroll: In this mode, you can view each row of microcharts as they automatically scroll from the top to the bottom. You can also manually navigate from one row to the next using the Previous and Next buttons on the right side of the widget, as shown below:

For steps to view microchart rows one at a time, see Enabling Vertical Scroll mode to view rows one at a time.
-
Ticker: In this mode, microcharts and supplemental text are displayed in a scrolling ticker that moves from right to left, as shown below. You can add text next to each microchart to provide background information or highlight a trend displayed in the microchart. This text is displayed alongside the microcharts as they scroll horizontally, as shown below:

For details, examples, and steps to view microchart rows as scrolling tickers, see Enabling Ticker mode to view microchart rows as scrolling tickers.
