MicroStrategy ONE
Enabling Grid/Graphs as selectors to control other Grid/Graphs
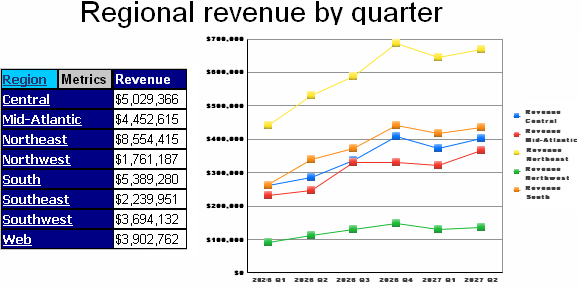
In the following image, two Grid/Graphs are shown. The one on the left, which is displayed as a grid, shows revenue by region. The one on the right, which is displayed as a graph, shows revenue by quarter and region. Notice that the two Grid/Graphs share a particular attribute (Region) and that Region in the grid is underlined, indicating a link.
The graph on the right represents regional revenue by quarter.
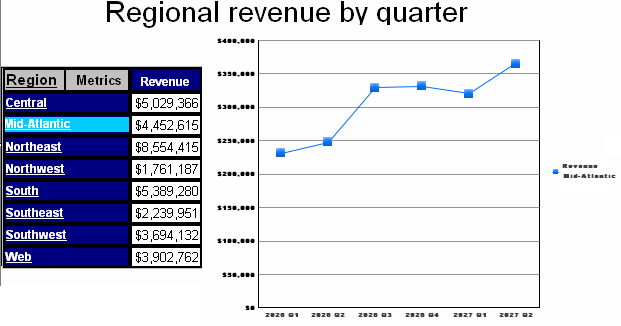
Click a specific region, such as Mid-Atlantic, in the grid. The graph changes to display information for that region only, as shown below:
The grid on the right is controlling the graph on the left. In other words, this scenario uses one Grid/Graph as a selector targeting another Grid/Graph. The Grid/Graph does not become a selector, but performs in a manner similar to a selector. A panel stack, rather than another Grid/Graph, can be the target of a Grid/Graph.
By default, the background for items selected in the Grid/Graph is automatically chosen to provide contrast with the Grid/Graph's background, as shown above. For Flash Mode in MicroStrategy Web, you can specify the color for the selected items. For an example and instructions, see Formatting the backgrounds of Grid/Graphs.
Cascading selectors
You can use Grid/Graphs as cascading selectors, where one Grid/Graph updates another Grid/Graph, the second updates a third, and so on. For example, a document contains the following:
-
A Revenue Grid/Graph containing the Revenue metric
-
A Call Center Grid/Graph containing the Call Center attribute, targeting the Revenue Grid/Graph
-
A Region Grid/Graph containing the Region attribute, targeting both the Call Center and Revenue Grid/Graphs
-
A Country Grid/Graph containing the Country attribute, targeting the Region, Call Center, and Revenue Grid/Graphs
When you select USA for Country, Southeast for Region, and Atlanta for Call Center, the Revenue metric displays the value for Atlanta. If you select Miami instead, the Revenue value changes accordingly.
To ensure that a selection in one Grid/Graph affects its targets, especially the Revenue Grid/Graph, you must define the Grid/Graphs in the order of the hierarchy's attributes. In this case, define the Grid/Graph for Country, then another for Region, and finally the last for Call Center. If you define Call Center first, then Region, and then Country, the targets are either not updated or return no data.
Prerequisite
This procedure assumes you have already created a Grid/Graph to use as the selector, as well as the panel stack or Grid/Graph to use as the target. The selector and target must have an attribute or metric in common. For instructions, see Adding panel stacks to documents and Displaying reports in documents: Grid/Graphs. If targets are automatically maintained, and you add a Grid/Graph or panel stack to the same document section or panel after defining this selector, the Grid/Graph or panel stack is automatically added as a target.
To enable a Grid/Graph as a selector
-
Open the document in Design view using the Document Editor. (How?)
-
Double-click the Grid/Graph to use as the selector. A red hashed border displays around it, indicating that the Grid/Graph is in edit mode.
-
Right-click the attribute to use as the selector, and choose Use asSelector. The Selector dialog box opens.
-
Select the target Grid/Graph or panel stack in the list of available controls on the right, and click > to add it to the list of selected targets. You can select multiple targets.
If targets are automatically maintained, you cannot select targets. All Grid/Graphs and panel stacks in the same document section or panel as the selected Grid/Graph are chosen as targets. You can disable automatic targets by clicking Manual Targets. If you do, all targets in the layout are no longer automatically maintained. For more information about disabling automatic target maintenance, see Automatically maintaining targets for selectors.
-
You can specify whether the Grid/Graph shows the All option, which allows the user to display all the attribute elements in the target at the same time. To enable the All option, select the Show option for All check box.
-
You can specify whether the Grid/Graph displays a Total option, which allows the user to display totals. To display the Total option, select the Show option for Total check box. For an example and more details, see Showing totals in selectors.
-
To determine how the target displays when no data exists, use the Automatically update when there is no data for the current selection check box. The selector that you want to be automatically updated must be on a panel. The selector that will update the first selector must target the panel stack. For an example, see Determining how the target of a selector displays when no data exists.
-
To display a message that no data is returned, clear the check box.
-
To display an item, select the check box.
-
-
Click Create to create the selector and return to the document.
-
Press ESC or click anywhere in the document's Layout area outside of the Grid/Graph to exit edit mode.