Strategy ONE
Defining Waterfall widgets
A Waterfall widget highlights the increments and decrements of the values of metrics over time. Analysts can use the widget to identify aspects of their business that are contributing to the fluctuations in the values. The widget can also be used to perform "what-if" analyses.
The widget consists of a group of clustered bars displayed from left to right. The X-axis contains either attribute elements or metrics, depending on where the attributes and metrics are placed on the Grid/Graph that contains the widget. The Y-axis displays a range of values based on the metrics on the Grid/Graph.
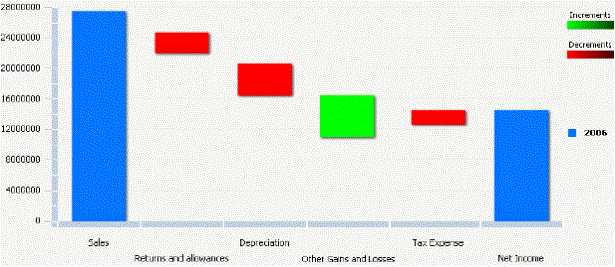
In the example shown below, metrics are displayed along the X-axis. The first bar represents the amount of sales revenue generated in 2026. The remaining bars in the widget represent the other metrics on the X-axis, including the Depreciation and Tax Expense metrics. These bars depict the business factors that diminished revenue and one factor (the Other Gains and Losses metric) that increased revenue. As a group, these bars highlight the contributions of various aspects of the business on total revenue from sales. This final value is represented by the last bar on the right, which represents Net Income for 2026.

The increments and decrements in a Waterfall widget can be calculated and displayed in any of the following ways:
-
Increments and decrements are calculated and displayed in the widget according to the metrics that are included on the Grid/Graph that contains the widget, and the order of those metrics.
-
It is recommended that you use this method when the metrics are on the rows of the Grid/Graph and the attributes are on the columns of the Grid/Graph. This allows you to place the metrics along the X-axis in a specific order and view the increment and decrement bars in that order.
-
To ensure that the metrics determine how increments and decrements are calculated and displayed, select the Increments/Decrements Provided check box.
-
-
Increments and decrements are automatically determined by the widget when it is displayed. They are calculated according to the metrics included on the Grid/Graph.
-
It is recommended that you use this method when the metrics are on the columns of the Grid/Graph and the attributes are on the rows of the Grid/Graph. Using this method requires that you have placed metrics on the columns that depict the total value for each unit of time.
-
To ensure that the widget automatically determines the increments and decrements, clear the Increments/Decrements Provided check box.
-
You can select and clear the Increments/Decrements Provided check box in Flash View in MicroStrategy Developer and in Express Mode in MicroStrategy Web to preview the results, but the change is not saved.
Data requirements for a Waterfall widget
To successfully create a useful Waterfall widget that can be used to analyze data, you must first correctly define the Grid/Graph. To do this, you must place report objects such as attributes and metrics on the Grid/Graph. The report objects and their placement on the Grid/Graph determine whether the Waterfall widget can be successfully generated and can display data.
The data requirements for a Waterfall widget are described below:
-
At least one metric on the rows or columns. Any number of metrics and attributes can be placed on the rows and columns.
-
Bars based on the metric values are displayed in the widget.
-
If attributes or metrics are placed on the rows, the attribute elements or metrics are displayed on the X-axis of the widget. If the rows contain both attributes and metrics, a combination of those objects is displayed.
If you want the metrics on the Grid/Graph to generate the increment and decrement bars in the widget, place the metrics on the rows.
-
If attributes and/or metrics are placed on the columns, attribute elements and metrics are displayed in the legend. If the columns contain both attributes and metrics, a combination of those objects is displayed.
A Waterfall widget does not need a separate selector to allow a user to interact with it. However, you can use a Waterfall widget as a selector. For an example and more information, see Using Waterfall widgets as selectors.
For instructions to create a widget, see Creating widgets. For information on formatting a Waterfall widget, see Formatting Waterfall widgets.
