MicroStrategy ONE
Defining Interactive Stacked Graph widgets
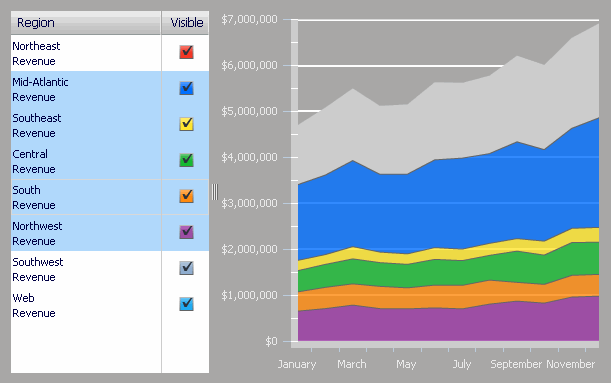
An Interactive Stacked Graph widget is a combination of a check box list and area graph. The graph allows a user to see the contribution of various metric series to the change in value of a larger set of data.
-
By selecting individual attribute elements (for example, a list of years) using the check boxes, analysts determine the data that is displayed on the area graph on the right. When all check boxes are selected, the area graph is at its maximum size because it is representing contributions from each individual element.
-
This widget allows you to visualize total metric values as one large stacked area, and the individual pieces of that total as smaller stacked areas within the large stacked area. You can quickly analyze how the individual parts make up the whole, which is useful when making percent-to-total comparisons. To see how the individual parts make up the whole, click the name of the attribute element on the left; you can select multiple items by holding CTRL and selecting elements.

The data requirements for this type of widget are simple. A designer must place the following on the Grid/Graph that contains the widget:
-
One attribute on the rows. This attribute is displayed on the graph's X-axis. In the image above, this is the Month of Year attribute.
-
One attribute on the columns. This attribute is represented by the check box list on the left. In the image above, this is the Region attribute.
-
One metric on the columns. This metric is displayed on the graph's Y-axis. In the image above, this is the Revenue metric.
Data requirements for an Interactive Stacked Graph widget
To successfully create a useful Interactive Stacked Graph widget that can be used to analyze data, you must first correctly define the Grid/Graph. To do this, you must place report objects such as attributes and metrics on the Grid/Graph. The report objects and their placement on the Grid/Graph determine whether the Interactive Stacked Graph widget can be successfully generated and can display data.
The data requirements for a Interactive Stacked Graph widget are described below:
-
Two attributes, one on the rows and one on the columns.
-
The attribute placed on the columns appears in the list of check boxes on the left side of the widget. For example, if you place a Category attribute on the columns and then switch to Flash Mode in MicroStrategy Web, the list of categories is displayed on the left as check boxes. You can select each check box to show or hide that specific data on the area graph.
-
Attributes placed on the columns must appear to the left of any metrics on the columns.
-
The attributes placed in the rows appear on the X-axis at the bottom of the area graph in the widget. For example, if you place a Region attribute in the rows and then switch to Flash Mode in MicroStrategy Web, the regions are listed on the X-axis (the horizontal graph line) at the bottom of the area graph.
-
Only one metric on the columns. The metric values are displayed on the Y-axis of the graph.
-
The metric must appear below (or to the right of) any attributes on the columns.
You can place any number of attributes on the Grid/Graph that contains the widget, but it can have only one metric.
An Interactive Stacked Graph widget does not need a separate selector to allow a user to interact with it. However, you can use an Interactive Stacked Graph widget as a selector. For an example and more information, see Using Interactive Stacked Graph widgets as selectors.
For instructions to create a widget, see Creating widgets. For information on formatting an Interactive Stacked Graph widget, see Formatting Interactive Stacked Graph widgets.
