MicroStrategy ONE
Enabling Grid mode to view rows in a tree
Steps to allow users to view microchart rows in a tree display
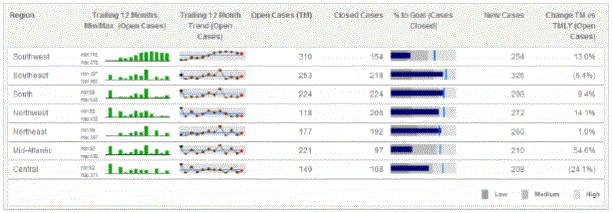
Grid mode displays all the rows of microcharts at the same time, from top to bottom, as shown below:

If the rows of the Grid/Graph have at least three attributes, each attribute except the right-most attribute is combined and displayed as a row in the widget. For example, if Region is the first attribute and Call Center is the second attribute, rows are displayed for Northeast Boston and Northeast New York.
You can specify that the widget groups and indents these rows in a hierarchical tree display. The groups can then be collapsed or expanded to show different levels of detail, with each level representing a different attribute.
In the image below, rows are grouped by the Region attribute. The Northeast group is expanded to display the elements of the Call Center attribute, with the rows Boston and New York. You can accommodate up to ten attributes in the tree display.

When the rows are displayed in the tree display, you can set the aggregation function. The aggregation function determines how the totals for the groups are calculated. For example, if a group consists of several regions, the aggregation function can be defined as Average, to average the metric values across all the regions in the group.
Enabling tree display and specifying the aggregation function must be done in Flash Mode in MicroStrategy Web, as described in the following procedure.
Prerequisite
This procedure assumes you have already created a Microcharts widget; for instructions, see Creating widgets.
To allow users to view microchart rows in a tree display
-
Use Flash Mode in MicroStrategy Web to open a document containing a Microcharts widget.
-
Right-click the widget and select Properties. The Microcharts Widget Properties dialog box opens.
-
By default, a Microcharts widget is displayed in Grid mode. If it is not, enable Grid mode:
-
From the drop-down list at the top left of the dialog box, select Mode.
-
On the Mode tab, from the Operation Mode drop-down list, select Grid.
-
-
Select the Tree display check box.
-
Select the Aggregation function from the drop-down list. The options are:
-
Sum
-
Average
-
Count
-
Max
-
Min
-
-
Click OK to apply the changes to the widget.
