Strategy ONE
Defining Funnel widgets
A Funnel widget allows you to quickly analyze various trends across several metric values. It can be used for a wide variety of business purposes, including application management, click management, pipeline analyses for sales forecasts, and sales process analysis.
The widget is a variation of a stacked percent bar chart that displays data that adds up to 100%. Therefore, it can allow analysts to visualize the percent contribution of sales data. It can also show the stages in a sales process and reveal the amount of potential revenue for each stage. When the widget is used to analyze a sales process, analysts can use the widget to drill down to key metrics such as deal size, profit potential, and probability of closing. The widget can also help identify potential problem areas in an organization's sales processes.
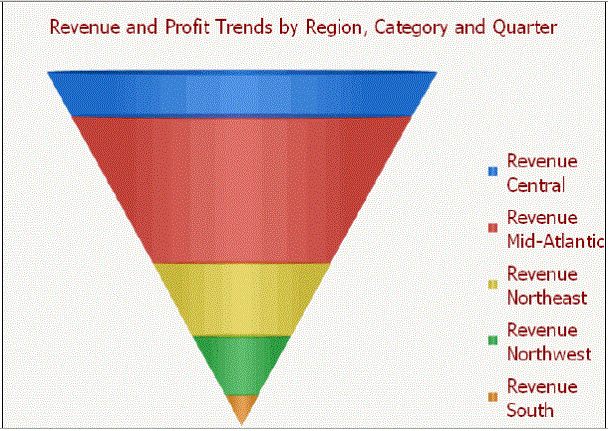
For example, the following Funnel widget displays the percent contribution of revenue data by region. Each section of the funnel is a different region, and the size of each section is proportional to the amount of revenue that the region contributed.

Data requirements for a Funnel widget
To successfully create a useful Funnel widget that can be used to analyze data, you must first correctly define the Grid/Graph. To do this, you must place report objects such as attributes and metrics on the Grid/Graph. The report objects and their placement on the Grid/Graph determine whether the Funnel widget can be successfully generated and can display data.
The data requirements for a Funnel widget are described below:
-
One attribute on the rows. The attribute elements are displayed as separate sections in the widget.
-
One metric on the columns. The metric values determine the size of each section of the widget.
A Funnel widget does not need a separate selector to allow a user to interact with it.
For instructions to create a widget, see Creating widgets. For information on formatting a Funnel widget, see Formatting Funnel widgets.
