MicroStrategy ONE
Defining Time Series Slider widgets
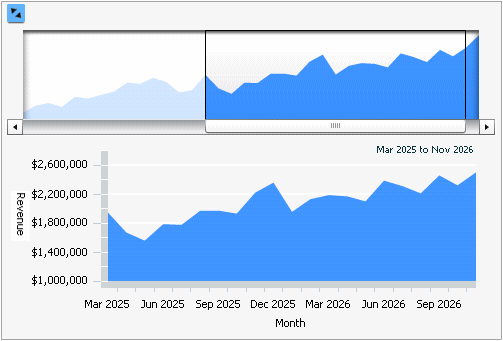
A Time Series Slider widget is an area graph that allows a document analyst to choose which section of the graph to view at a time. The widget consists of two related graphs, one positioned above the other. The top graph is the controller, and contains a slider. The bottom graph is the primary graph. You use the slider on the controller (the top graph) to select some portion of the controller, which determines the range of data visible in the primary graph (the bottom graph).
Time series datasets are often long and require analysis from both a macro and micro view. Therefore, the time series slider widget requires only one attribute, preferably one with many values. This attribute is normally time-based, but it does not have to be. The widget also requires only one metric. In the graph:
-
The X-axis represents the attribute. In the image below, this is the Month attribute.
-
The Y-axis represents the metric. In the image below, this is the Revenue metric.
If you include two metrics on the columns of the Grid/Graph that contains the widget, a line graph is displayed with the area graph.
Data requirements for a Time Series Slider widget
To successfully create a useful Time Series Slider widget that can be used to analyze data, you must first correctly define the Grid/Graph. To do this, you must place report objects such as attributes and metrics on the Grid/Graph. The report objects and their placement on the Grid/Graph determine whether the Time Series Slider widget can be successfully generated and can display data.
The data requirements for a Time Series Slider widget are described below:
-
One attribute on the rows, preferably time-based. The attribute elements are displayed along the X-axis.
-
One metric on the columns. The metric values are displayed along the Y-axis. If you include two metrics, a line graph and an area graph are displayed together.
You can place any number of attributes and metrics on the widget template; there is no maximum number of attributes and metrics.
A Time Series Slider widget does not require a separate selector to allow a user to interact with it. However, you can add a selector to allow users to change the attributes that are displayed in the widget. If you add a selector, it is also recommended that you include the corresponding Grid/Graph as well. This allows users to see the Grid/Graph's values as they choose different attribute elements from the selector.
A Time Series Slider widget can be used as a selector. For an example and more information, see Using Time Series Slider widgets as selectors.
For instructions to create a widget, see Creating widgets. For information on formatting a Time Series Slider widget, see Formatting Time Series Slider widgets.