Strategy ONE
Defining Cylinder widgets
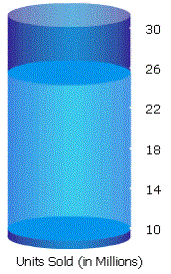
A Cylinder widget is a simple status indicator that displays a vertical cylinder with fluid in it. The level of the fluid within the cylinder is a visual representation of a single metric value. Like the Gauge and Thermometer widgets, this type of widget is designed to display the value of a single metric.
The Cylinder widget is most useful when combined with a selector because this allows users to choose specific metric values to display in the cylinder.
In the image below, the liquid level in the cylinder represents the number of units sold in millions (the Units Sold metric).

Data requirements for a Cylinder widget
To successfully create a useful Cylinder widget that can be used to analyze data, you must first correctly define the Grid/Graph that contains the widget. To do this, you must place report objects such as attributes and metrics on the Grid/Graph. The report objects and their placement on the Grid/Graph determine whether the Cylinder widget can be successfully generated and can display data.
The data requirements for a Cylinder widget are described below:
One attribute on the rows. The attribute elements are displayed in the selector that you use to display different data in the widget.
One metric on the columns. The metric values determine the amount of liquid displayed in the cylinder.
A Cylinder widget requires a selector to allow a user to interact with it. For information about selectors, including procedures to create them, see Providing interactivity to users: Selectors.
It is recommended that you place the corresponding Grid/Graph beneath the selector. This allows you to see the Grid/Graph's values as you select different attribute elements from the selector and see how they change the appearance of the Cylinder widget.
For instructions to create a widget, see Creating widgets. For information on formatting a Cylinder widget, see Formatting Cylinder widgets.
