MicroStrategy ONE
Enabling drilling in an Interactive Bubble Graph widget
When you use an Interactive Bubble Graph widget in a document, you can choose to enable drilling on the widget by adding one additional attribute (a second attribute) to the right of the attribute in the rows of the Grid/Graph that contains the widget. This second attribute must be a child attribute of the parent attribute already on the rows. For example, in the image below, the parent attribute is Region and the Call Center Custom Group attribute is the child attribute.
To enable drilling on the graph, the child attribute must be structured in a specific way. You can create this structure by either:
Once the Grid/Graph contains the necessary objects (either a custom group or subtotals), you must open the document in MicroStrategy Web in Flash Mode or Interactive Mode to enable drilling within the widget.
The requirements for an Interactive Bubble Graph with drilling enabled are:
-
A second attribute placed to the right of the first attribute on the rows of the Grid/Graph.
-
This attribute must be the child attribute, while the first attribute is the parent attribute.
-
This second attribute must have a specific data structure so that the first grid row displays the total for the child attribute. This can be achieved by using a custom group or subtotals, as described above.
-
Enable drilling on the widget in Flash Mode or Interactive Mode in MicroStrategy Web.
You can enable the time-series analysis check box in Flash View in MicroStrategy Developer and in Express Mode in MicroStrategy Web, but the change is not saved.
To enable both drilling and time series animation in an Interactive Bubble Graph widget, you must have at least three attributes on the rows of the associated Grid/Graph. The attribute on the left must be an attribute associated with time, and the second and third attributes must have a parent/child relationship as described above.
Enabling drilling using a custom group
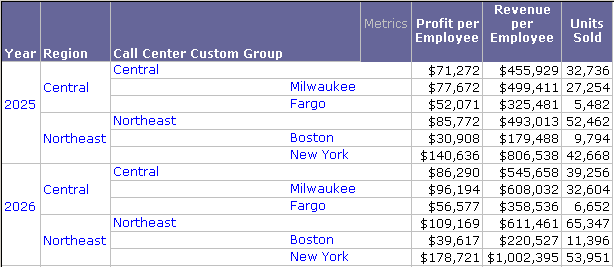
The structure that allows drilling can be created with a custom group. The data in the grid for the child attribute must be displayed so that the total for the child attribute is in the top row of data, followed by the data for the child attribute. A custom group allows you to easily ensure that this occurs. An example of this type of data in grid form is shown in the image below. In the custom group, notice that the first element within the Northeast region is Northeast. This is followed by the two child attribute elements, Boston and New York.
For information on creating custom groups in MicroStrategy Developer, see Custom groups.
In the metric data, the first row represents the total (Average for the first two metrics, Sum for the third) of the other two rows. The first row must include totals for drilling to work properly.

Instead of creating a custom group, you can add subtotals, without grand totals, when you create the original report. The subtotals must be calculated by row and must be displayed at the top of each level. This ensures that the total for the second attribute is displayed in the top row of data, followed by the data for that attribute. Be sure to add the Grid/Graph to the document with formatting, so that this structure is used.
Enabling drilling using subtotals
As an alternative to creating a custom group, you can add subtotals, without grand totals, when you create the original report. The subtotals must be calculated across the level of the child attribute and must be displayed at the top of each level. This ensures that the total for the second attribute is displayed in the top row of data, followed by the data for that attribute. Be sure to add the Grid/Graph to the document with formatting, so that this structure is used.
For instructions to add a Grid/Graph with formatting, see Displaying reports in documents: Grid/Graphs. For instructions to display subtotals, see Applying subtotals to a report.
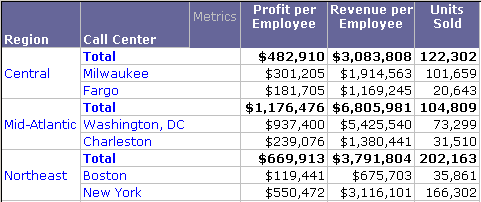
For example, the following report is subtotaled across the level of Call Center, which is the child attribute of Region. The subtotals are displayed at the top of each region.

