MicroStrategy ONE
Using Interactive Bubble Graph widgets as selectors
Report objects in an Interactive Bubble Graph widget can be defined as selectors, as described in Viewing data related to widgets: Using widgets as selectors. In MicroStrategy Web, users can interact with the widget to control targeted Grid/Graphs and panel stacks in the document.
In MicroStrategy Web, the following parts of an Interactive Bubble Graph widget can be used as selectors to display data in Grid/Graphs and panel stacks:
-
The bubbles in the widget can be used as selectors if their corresponding attributes are enabled as selectors in the Grid/Graph that contains the widget.
For example, a user can click a Northeast region bubble to display Northeast data in all target Grid/Graphs and panel stacks.
A user can double-click a bubble to drill down to the child elements of that bubble and to display data in the Report Services (RS) dashboard related to the bubble. To display data related to the drill-to element, a user can click the child bubble. All target Grid/Graphs and panel stacks are updated with data related to the selection. For more information about drilling in an Interactive Bubble Graph widget, see Enabling drilling in an Interactive Bubble Graph widget.
-
The attribute elements in thelegend can be used as selectors if the columns of the Grid/Graph contain an attribute that is enabled as a selector.
A user can click an attribute element in the legend. Only one item in the legend can be selected at a time. For example, a user can click the legend item for the Central region to display data for the Central region in all target Grid/Graphs and panel stacks.
When a user hovers the cursor over these selectable parts of the widget, the cursor turns into a hand, indicating that it can be selected.
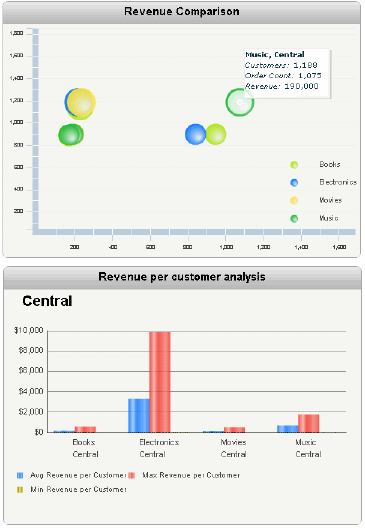
For example, the Region attribute in the Interactive Bubble widget below is enabled as a selector. When a user selects a region bubble from the widget, the target graph at the bottom is updated with data related to that region.

A user can also select multiple bubbles, by dragging a selection box (or lasso) around the bubbles. For example, a user drags a selection box around the two Electronics and Books bubbles in the middle of the widget. If the selection box is set to automatically update the target, the target graph displays data related to those bubbles. Otherwise, the user must click the Selecticon in the button bar to update the target graph.
To use a widget as a selector, you first choose the target Grid/Graph and/or panel stack in MicroStrategy Developer. You can also do this in Design Mode or Editable Mode in MicroStrategy Web. For details and steps, see Viewing data related to widgets: Using widgets as selectors.
You can use MicroStrategy Web to ensure that target Grid/Graphs and panel stacks are updated when a user hovers over a bubble or an item in the legend, instead of clicking it.
