MicroStrategy ONE
Using Time Series Slider widgets as selectors
Report objects on a Time Series Slider widget can be defined as selectors, as described in Viewing data related to widgets: Using widgets as selectors. In Flash Mode in MicroStrategy Web, users can then interact with the widget to control targeted Grid/Graphs and panel stacks in the document.
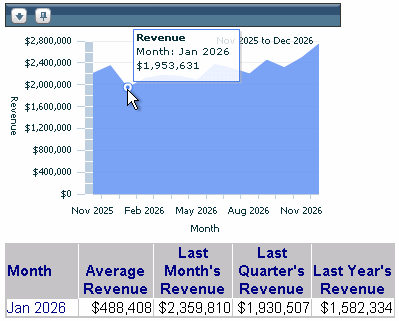
In MicroStrategy Developer, or in Design Mode or Editable Mode in MicroStrategy Web, open the Grid/Graph that contains the widget. Enable one or more objects as selectors. Then, switch to Flash Mode in MicroStrategy Web to use the primary graph at the bottom of the widget as a selector. A user can hover over and select an individual data point in the graph to display related data in the target Grid/Graphs and panel stacks. For example, a user can select the data point for January 2026 revenue, and all data in the target Grid/Graphs and panel stacks is updated.
In MicroStrategy Developer, or in Design Mode or Editable Mode in MicroStrategy Web, you must enable one or more objects on the Grid/Graph that contains the widget as selectors. Next, switch to Flash Mode to use the primary graph at the bottom of the widget as a selector. A user can hover over and select an individual data point in the graph to display related data in the target Grid/Graphs and panel stacks. For example, a user can select the data point for January 2026 revenue, and all data in the target Grid/Graphs and panel stacks is updated.
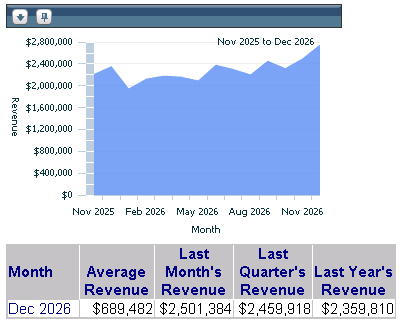
The following document is shown in Flash Mode in MicroStrategy Web. Revenue data related to the last data point in the Time Series Slider widget, in this case December 2026, is shown in the grid report below the widget.

If you click the data point for January 2026, the grid report displays the revenue data related to that date, as shown below.

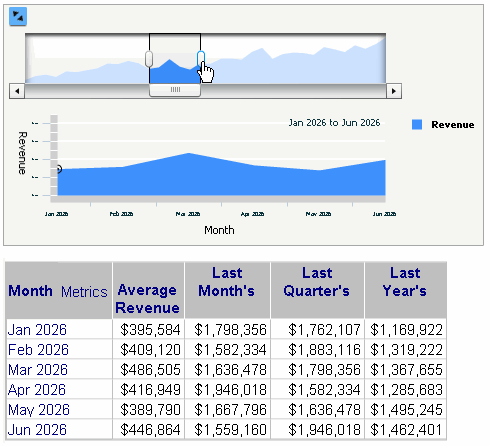
This example uses the primary graph as the selector, but you can change it to use the slider instead. Instead of clicking a single data point (in this case, a single month) you can instead select a range of months. In the following example, the slider is set to January 2026 through June 2026, and the grid report displays the data for that time frame.

To change from using the primary graph as the selector to using the slider, you must format the properties of the widget in Flash Mode in MicroStrategy Web. For more information, see the MicroStrategy Web Help.
While the widget in this example targets a Grid/Graph, it could target multiple Grid/Graphs, a panel stack, or multiple panel stacks instead.
To use a widget as a selector, you first choose the target Grid/Graph and/or panel stack in MicroStrategy Developer. You can also do this in Design Mode or Editable Mode in MicroStrategy Web. For details and steps, see Viewing data related to widgets: Using widgets as selectors.
In Flash Mode in MicroStrategy Web, you can ensure that target Grid/Graphs and panel stacks are updated when a user hovers over a data point in the primary graph, instead of clicking the data point. For the procedure, refer to the MicroStrategy Web Help.
