Strategy One
Introduction to Analyzing Data in a Thermometer Widget
A Thermometer widget is a simple status indicator that displays a thermometer which indicates a certain temperature level. The temperature level within the thermometer is a visual representation of a single metric value. This type of widget is ideal for tracking progress toward a goal. Like the Gauge and Cylinder widgets, this type of widget is designed to display the value of a single metric.
This is a Flash-based widget, which displays in Flash Mode. For newly created documents, Flash Mode is deprecated and replaced by Presentation Mode. In Presentation Mode, a Flash-based widget is hidden or is displayed as a grid, a graph, or a placeholder showing a message, as set by the document designer.
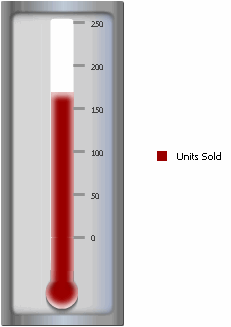
In the image below, the thermometer level represents the number of units sold.

A Thermometer widget is usually combined with an interactive selector so you can choose an attribute element for which to display a metric value in the thermometer. For example, you can select the year 2008 from a selector or report to update the widget with a related metric value.
