Strategy One
Introduction to Analyzing Data in a Waterfall Widget
A Waterfall widget highlights the increments and decrements of the values of metrics over time. You can use the widget to identify aspects of your business that are contributing to the fluctuations in the values. The widget can also be used to perform "what-if" analyses.
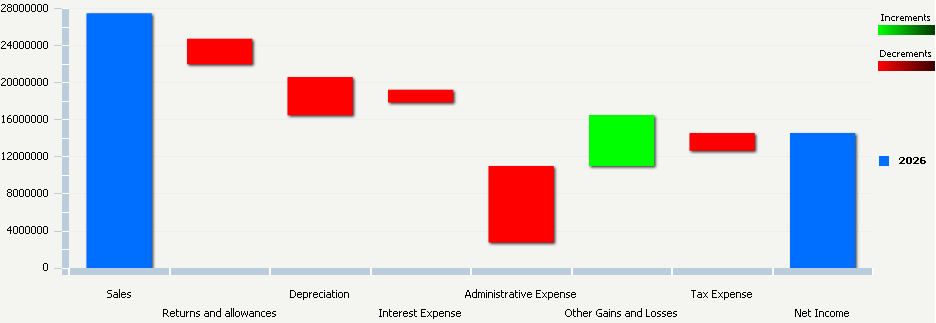
The widget consists of a group of clustered bars displayed from left to right. The X-axis contains either attribute elements or metrics, depending on where the attributes and metrics are placed on the widget. The Y-axis displays a range of values based on the metrics on the widget. The increments and decrements in the widget are calculated and displayed according to the metrics included on the report that contains the widget, and the order of those metrics.
In the example shown below, metrics are displayed along the X-axis. The first bar represents the amount of sales revenue generated in 2006. The remaining bars in the widget represent the other metrics on the X-axis, including the Depreciation and Tax Expense metrics. These bars depict the business factors that diminished revenue and one factor (the Other Gains and Losses metric) that increased revenue. As a group, these bars highlight the contributions of various aspects of the business on total revenue from sales. This final value is represented by the last bar on the right, which represents Net Income for 2006.

You can analyze the data in a Waterfall widget with a what-if analysis, which displays the effect of a change in one increment or decrement on the final total. (Available if the designer has enabled what-if analysis.)
To Conduct a What-If Analysis on a Waterfall Widget
- Click the top or bottom of the bar whose value you want to change. A tooltip with the value of the bar displays.
- Drag the top or bottom of the bar until the tooltip displays the target value. The waterfall widget recalculates the height of the bar and repositions all following bars based on the new value. The height of the final total bar grows or shrinks accordingly.
