Strategy One
Introduction to Analyzing Data in a Gauge Widget
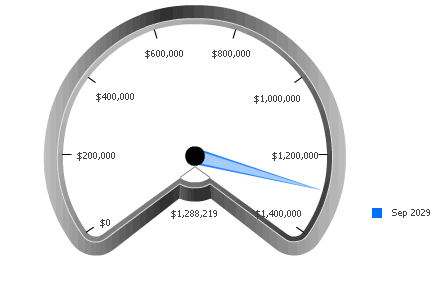
A Gauge widget is a simple status indicator that displays a needle that moves within a range of numbers displayed around its outer edge. A real-world example of a gauge is a car's speedometer. This type of widget is designed to display the value of a single metric. The needle within the gauge is a visual representation of that single metric value.
In the image below, the location of the needle in the gauge represents the amount of revenue generated (the Revenue metric).

A Gauge widget is usually combined with an interactive selector so you can choose an attribute element, and the metric value for that element is displayed in the gauge. For example, you can select the Southwest region from a selector or report to have the Gauge widget display Southwest's revenue.
