MicroStrategy ONE
Introduction to Analyzing Data in a Bubble Grid Widget
The Bubble Grid widget allows you to quickly identify important trends or anomalies in data, relative to the total contribution of accompanying data.
The Bubble Grid widget displays information to help you identify important trends or anomalies in data, relative to the total contribution of accompanying data. In the widget, metric values are plotted as bubbles of different colors and sizes; the colors and sizes of the bubbles represent the values of two distinct metrics on the widget. Each bubble is generated at the intersection of two different attribute elements.
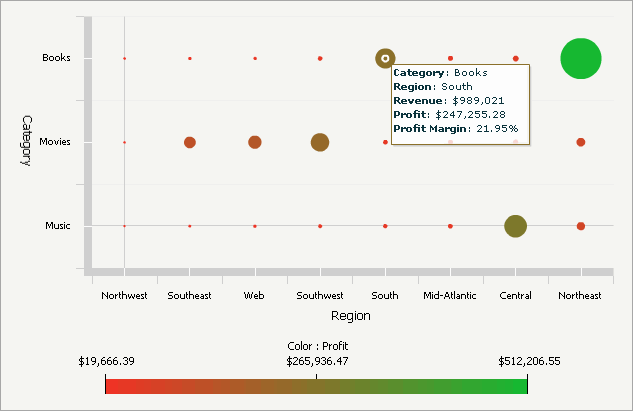
For example, in the widget below, a single bubble depicts the profit and revenue for books (an element of the Category attribute) in the South region (an element of the Region attribute). The Revenue metric value determines the size of the bubble, while the Profit metric value determines the color. When you hover the cursor over a bubble, a tooltip is displayed. Notice that in the tooltip shown below, data for a third metric, Profit Margin, is shown. The Profit Margin data does not affect the size or color of the bubbles, but is provided for additional information.

The Bubble Grid widget is most beneficial when it is used to perform analyses involving key business ratios, such as the number of customers in a store vs. the revenue generated per customer. For example, the widget can help you investigate questions such as "Does the number of customers that visit a certain store correlate to the amount of money each customer spends?" You can use the widget to answer these types of questions in the context of business attributes, such as different stores, regions, and times of the day or year. Positive correlations in the data show that stores with a large number of customers generate a large amount of revenue, and negative correlations show the opposite. When you detect negative correlations for stores in specific regions, you can investigate reasons for the issue and recommend changes such as adding more sales personnel to the stores.
The bubbles in the widget may act as selectors, so that clicking a bubble updates all target Grid/Graphs and panel stacks in the document that display data related to the bubble.
