MicroStrategy ONE
Introduction to Analyzing Data in a Network Widget
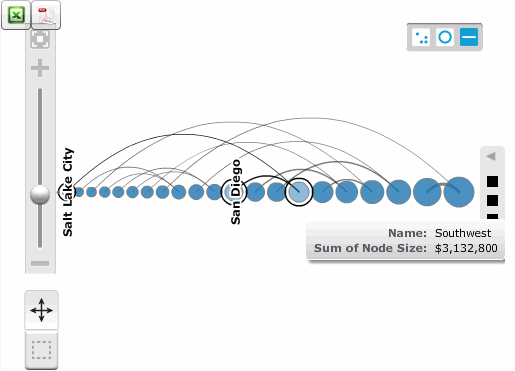
The Network widget allows you to quickly view data about individual items and the relationships between them in a visual format. Business attributes are represented by circular nodes, while the lines between the nodes (called edges) represent relationships between the attributes.
You can view additional information about an
item in the widget by hovering the cursor over a node or edge. A tooltip
is automatically displayed in the widget, showing the attribute and metric
values associated with the node or edge. To zoom in or out on the widget,
click and drag the thumb on the slider in the top left of the widget.
You can click the Fit to Screen
icon ![]() on the top of the slider to size the widget so that all nodes and edges
are displayed in the widget.
on the top of the slider to size the widget so that all nodes and edges
are displayed in the widget.

You can reposition a node, select multiple nodes, or click and drag on an empty area in the widget to pan your display. Do one of the following:
- To reposition a node, click and drag the node to its new location.
- To
select multiple nodes, click the Select
icon
 ,
then click and drag over the nodes you want to select.
 - To
pan your display of the widget, click the Pan
icon
 , then
click and drag in the direction of the area you want to view.
You can change the layout style used to display nodes in the widget. Do one of the following:
- To
display the nodes with edges of similar length, minimizing the number
of times the edges cross each other, select the Force-directed
Layout icon
 in
the top right.
 - To
display the nodes in a circular layout, select the Circular
Layout icon
 in the top right. A circular layout makes it easy to identify clusters
and relationships in the widget.
 - To
display the nodes in a straight line, select the Linear
Layout icon
 in the top right. The linear
layout makes it easy to see where edges begin and end (if the edges
are displayed as arrows), as well as groups of closely related nodes.
By default, a legend is displayed on the right side of the widget, which contains information on node size, edge size, edge color, etc. You can expand or collapse the legend by clicking the arrow icon at the top of the legend.
