Strategy One
Introduction to Analyzing Data in an Image Layout Widget
An Image Layout widget displays an image overlaid with colored areas or bubble markers. For example, a designer can display the layout of a store in the widget, with each aisle shown as a separate region, then have each aisle colored based on the number of visits the aisle receives.
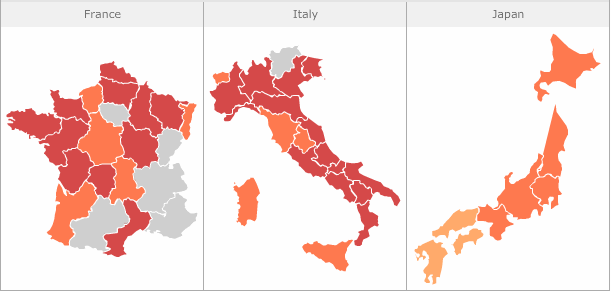
If the widget contains multiple images in a table, as displayed below, you can size rows or columns of images. Hover the cursor over the edge of a row or column, so that the cursor becomes double arrows, then click and drag the edge to its new location. A designer can enable you to select which images are displayed in the widget. In the example below, the Image Layout widget only displays maps for countries chosen in the World Country selector to its left.

You can display additional information about an area or bubble marker in a pop-up tooltip by hovering the cursor over the item in the widget. Depending on how the widget was designed, you can click areas or bubble markers in the widget to update the data displayed in the document.
