Strategy One
How to Apply Color Banding to a Report
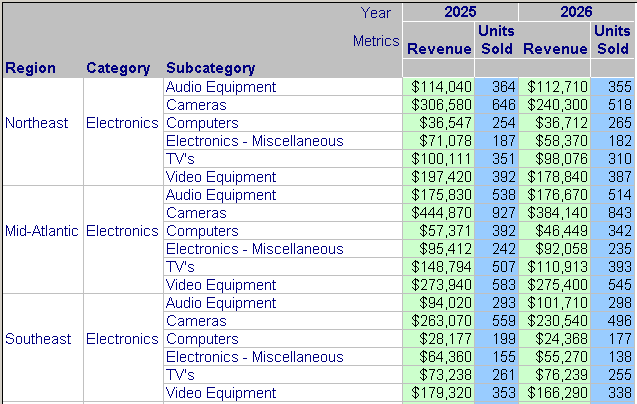
You can apply background colors to alternating rows on a grid report, including a grid displayed on a document. This is called banding. Banding helps you view the data on a report more easily. If you apply banding to a report and save the report, the current banding setting is saved along with the report definition. See the image below for an example of a banded report:

Some autostyles, such as Colorful and Accounting, have banding as part of their format. When one of these autostyles is applied to a report, the banding is applied to the report as well. For an introduction to autostyles, see the Advanced Reporting Help.
If column banding is enabled in MicroStrategy Developer, column banding can be displayed in Strategy Web when color banding is enabled.
To Show or Hide Banding on a Report
- Click the name of a grid report to execute it.
- From the Tools menu, select Report Options.
- Select the Show Banding checkbox.
- If DHTML is disabled, click Go.
To Show or Hide Banding on a Report in a Document
- Edit the document that contains the report.
- In Editable Mode or Design Mode, click the report to select it.
- On the Grid toolbar, click the Banding icon
 to switch between showing and hiding the banding.
 - To display the Grid toolbar, click Grid on the menu bar.
