MicroStrategy ONE
Creating an interactive document: the Blank Dashboard template
In general, a document template provides a predefined structure to help you create a new document. Any new document made using a document template contains the same underlying datasets, fields, formatting, and layouts as the template document. After the new document is created, you can customize it as you want.
MicroStrategy provides predefined document templates, including the Blank Document template and the Blank Dashboard template. Use the Blank Dashboard template to help you create the look and feel of an interactive document with the key features described below:
-
An interactive document is commonly only one page long, so the Blank Dashboard template uses only one document section. The height of the document section is defined as seven inches.
For descriptions of the various document sections that are available in a document, see Understanding and working with document sections.
-
Grid/Graphs are formatted with a background fill and a border. Title bars are displayed for Grid/Graphs, and they use a gradient color (a two-color combination) to provide more sophisticated formatting. The Grid/Graph has a fixed width and height; if the Grid/Graph is larger, scroll bars are displayed. These defaults help you create the feel of a portal if you include several Grid/Graphs on your document. A user can display all the Grid/Graphs, or minimize the ones that are not relevant at the moment to focus on a particular Grid/Graph.
-
Panel stacks are formatted with a background fill and a title bar. The title bars, which help users identify the objects, are formatted with a gradient color. Again, these defaults help you create the feel of an interactive document or a portal.
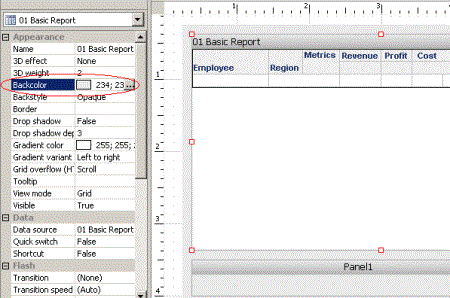
The following interactive document, which is shown in Design View, was created using the Blank Dashboard template. It contains a Grid/Graph and a panel stack. Notice that the Grid/Graph is formatted with a light gray background fill (the Backcolor).

These are the default properties of the Blank Dashboard, so you can change them if necessary. For example, you can change the height of the section, display additional sections, remove title bars from a Grid/Graph, and so on.
Other predefined dashboard-style templates provide other common structures for interactive documents, such as four evenly-spaced panel stacks to place contents in, one panel stack on the left side of the document and two smaller ones on the right, or a text field across the top of the document for a title bar with a panel stack below it.
To create a traditional document rather than an interactive document, use the Blank Document template.
For background information on templates, see Creating document templates and Creating documents using templates.
To create an interactive document using the Blank Dashboard template
-
From the File menu, point to New, and then select Document. The New Document dialog box opens, showing a selection of pre-generated document templates.
If the Select a report dialog box opens, object templates are disabled for documents. You must enable them before you can select a document template. For instructions, see Enabling object templates.
-
Click the Dashboards tab, select Blank Dashboard, and then click OK. The Select a Report dialog box opens.
-
Navigate through the report folders and select the MicroStrategy report or reports to use as datasets. To select multiple reports, hold the SHIFT or CTRL key while selecting the reports.
If you select multiple reports, all the selected reports are added to the document. The first dataset in alphabetical order is defined as the grouping and sorting dataset. You can sort and group the document using fields from the grouping and sorting dataset only. For instructions to change the grouping and sorting dataset and background information on using multiple datasets in the document, see Changing the grouping and sorting dataset for a document and Using datasets in documents.
-
Click OK. The Document Editor opens. The datasets that you chose are displayed in the Datasets pane.
-
Add data fields, auto text codes, text labels, images, panel stacks, selectors, widgets, and other controls. For instructions, see:
-
Arrange the controls as you like. For instructions, see:
-
Format the various controls and sections, as well as the document as a whole. For descriptions of the various formatting options, and instructions to apply them, see:
-
Formatting documents (for all other controls)
-
-
Group and sort the data.
-
For instructions to group data, see Grouping records in a document.
-
For instructions to sort the data, see Sorting a document.
-
-
Add totals, if desired. For instructions, see Calculating totals and summary metrics in documents.
The toolbar contains an Undo button that allows you to roll back actions you did in error. This includes formatting, totals, grouping, sorting, adding data, and so on.
-
Save the document by selecting Save from the File menu.
-
You can now preview how the document displays in MicroStrategy Web. This is useful to help you size and place objects. You can also manipulate the data in some of the ways that are available in Flash Mode.
-
Use Flash View to preview the document as it will look in Flash mode in MicroStrategy Web. You can use selectors and perform some manipulations such as pivoting and sorting. To open the document in Flash View, from the View menu, select Flash.
-
Use HTML View to preview the document as it will look in other MicroStrategy Web modes. To open the document in HTML View, from the View menu, select HTML.
-
-
For a list of actions that you can perform in Flash View and HTML View, see Previewing documents for MicroStrategy Web.
-
To print the document, use PDF View, as described in Printing documents.
Related Topics
For examples of interactive documents, see What is an interactive dashboard-style document? and Design ideas and examples.
