Strategy One
Create a Nested Metric
Beginning in Strategy One (June 2025), the Metric Editor in Workstation has been updated to improve usability, functionality, and performance. It now includes creating base formulas and adding levels, conditions, and transformations to all layers of nested metrics, functions available in MicroStrategy Developer.
You can create and add metrics to a Strategy project to perform calculations on your business data. Metrics represent business measures and key performance indicators. Use these metrics on reports, documents, and dashboards to analyze your data.
To create a metric, you define the metric's formula, which consists of the following:
- Function: The calculation applied to your business data, such as Sum or Count. Your metric may contain multiple functions.
- Expression: The business data from your data source. The expression can contain business facts, attributes, or other metrics.
Nested metrics contain multiple layers of functions. They are sometimes referred to as nested aggregation metrics, because their formulas contain one aggregation function enclosed inside another. For example:
Avg(Sum(Revenue))
The inner function Sum calculates the total for the Revenue fact, and the outer function Avg calculates the average of that result.
Nested metrics are useful when your data source does not store fact data at the level needed for a specific analysis. They are best used with each formula aggregated at a different attribute level. For information on levels, see Level Metrics: Changing the Level of Calculation for Metrics.
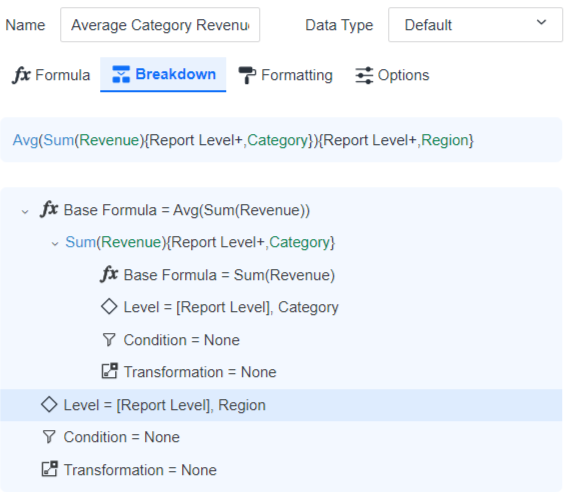
For example, you want to know the average revenue per category for every region. Create a nested metric that first calculates the revenue for all categories, and then calculates the average for each region. The metric is defined as:
Avg(Sum(Revenue) {~+, Category}) {~+, Region}
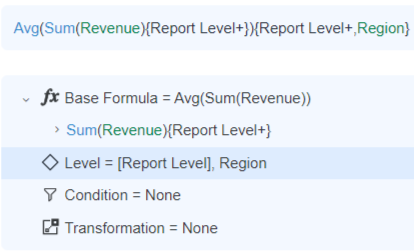
The inner formula, Sum(Revenue), calculates the revenue at the Category level. The outer formula then calculates the average of the resulting values at the Region level. In the Metric Editor, the inner formula appears as a child of the outer formula, as shown below:
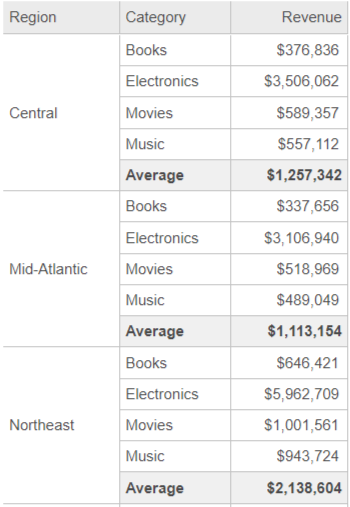
The following report uses the above metric to display the average category revenue for each region.
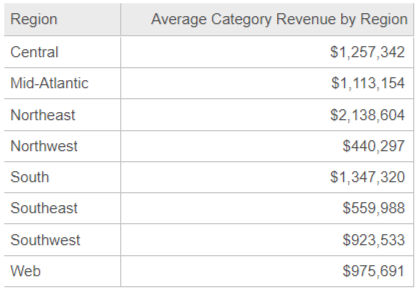
This is similar to creating a report that calculates the revenue by category for each region, and then enabling the Average subtotal, as shown below. The value of the Average subtotal is reflected in each row of the previous report, that is, Central region's Average Category Revenue by Region is $1,257,342 in both reports.
Stand-Alone Vs. Derived Metrics
This topic discusses stand-alone metric objects. You can also create derived metrics within reports, dashboards, and documents. They are not saved as separate objects. See:
-
Metrics in Dashboards for an introduction to derived metrics created in dashboards
Create a Nested Metric
- Open the Workstation window.
- From the File menu, select New Metric.
- If you are connected to multiple environments or projects, select an environment and project. The Metric Editor dialog box opens.
-
Click the metric Name, type a new name, and press
Enter. -
Choose a data type for the metric in the Data Type drop-down list.
-
Some data types allow you to format them. For example, if you choose Binary, you can set the Byte Length; if you select Decimal you can set the Precision and Scale. When formatting is available, the More Settings (three dots) icon
 becomes available. Click it to set the formatting.
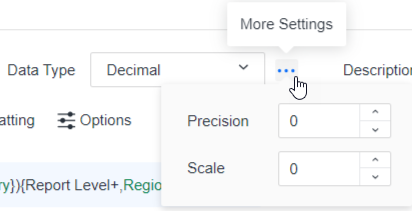
-
-
Type a Description for the metric.
You can type the metric formula in the Formula tab or use the Objects pane and the Functions pane for a more guided experience. The steps below use a combination of both.
Create the formula
-
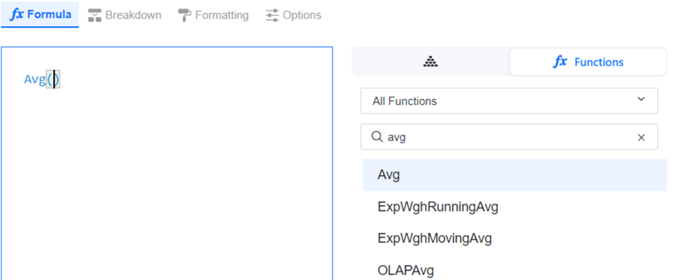
Click the Functions pane
 .
. -
In the Functions pane, search for and then double-click the function for the outer formula. A nested metric uses aggregation functions in both its inner and outer formulas. To continue with the example in the introduction, you select the Avg function.
-
In the Functions pane, search for and then double-click the function for the inner formula. A nested metric uses aggregation functions in both its inner and outer formulas. Be sure to add the function between the parentheses () of the outer formula. To continue with the example in the introduction, you select the Sum function.

-
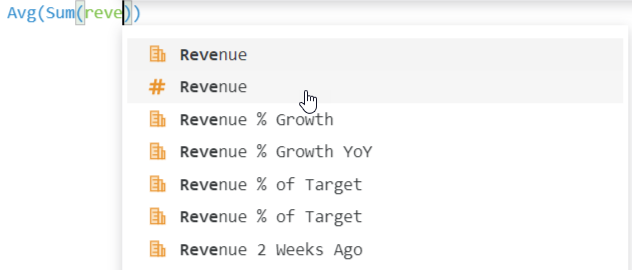
In the Formula pane, begin typing the object that the inner function will act on. Select the object's name. Be sure to add the object between the parentheses () of the inner formula. To continue with the example in the introduction, you select the Revenue fact.
-
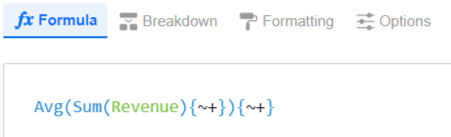
Click Validate to check the formula and automatically fill in parameters and report level. In the example below, information about the level displays between curly braces {}. This indicates that both formulas use report level with standard filtering and standard aggregation.
-
Click OK to save the formula and enable the other tabs such as Breakdown.
-
Click Breakdown to define the attribute levels. (Levels are optional although nested metrics typically contain them.) For more information about level metrics, including details on the filtering, aggregation, and advanced options, see Level Metrics: Changing the Level of Calculation for Metrics.
Add a level for the outer formula
-
Click Level.
-
In the Level area, click Add New and choose Select an Object.
-
Search for or navigate to the attribute to use as the level's target, then click Select.
-
Select a Filtering option from the drop-down list. This determines how the report filter affects the metric calculation.
-
Select an Aggregation option from the drop-down list. This determines whether the metric calculates at the target attribute level or if it excludes it.
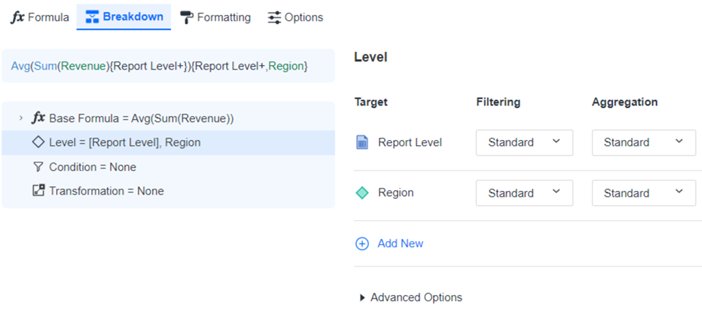
In the example below, Region has been added as a level.
-
You can add other levels and/or remove the report level. For information on how the report level works and the effects of removing it, see Report Level: Interaction with the Context of Reports.
Add a level for the inner formula
Beginning in Strategy One (May 2025), you can view and edit the levels, conditions, and transformations for the inner formulas of nested metrics.
-
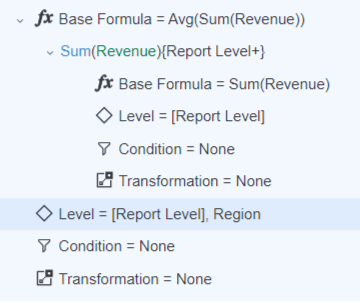
Expand the Base Formula, as shown below.
-
Expand the inner formula, as shown below.
-
Click Level in the inner formula.
-
In the Level area, click Add New and choose Select an Object.
-
Search for or navigate to the attribute to use as the level's target, then click Select.
-
Select a Filtering option from the drop-down list. This determines how the report filter affects the metric calculation.
-
Select an Aggregation option from the drop-down list. This determines whether the metric calculates at the target attribute level or if it excludes it.
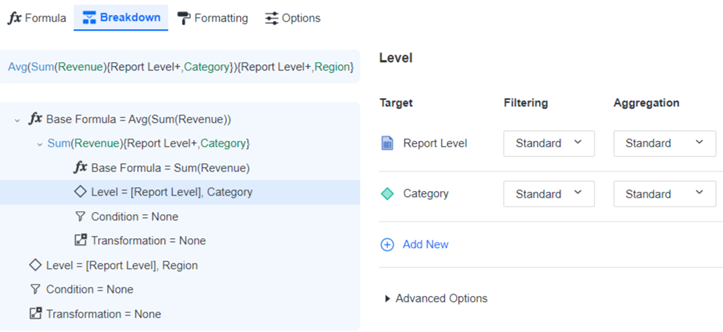
In the example below, Category has been added as a level.
-
You can add other levels and/or remove the report level.
Continue defining the metric
- You
can further define the metric by adding conditions
and/or transformations to the inner and outer formulas.
To filter the data included in the metric, add a condition to the metric. For example, a conditional metric calculates revenue for a specific region or time frame.
Click here for steps to add a condition. You can add multiple conditions to the metric.Click Condition in either the inner or outer formula.
In the Condition area, click Add New.
Search for or navigate to the filter to apply to the metric, then click Select.
When a report contains a filter and a conditional metric, the report filter and the filter contained in the metric (the metric filter or metric condition) interact to produce the data for the conditional metric. The advanced options for the conditional metric establish this interaction.
Metric conditions (also called metric filters) are applied to the metric without affecting any other metrics on a report, document, or dashboard. For background information, including details on the advanced options, see Conditional Metrics: Applying Filters to Metrics. For information on report filters, which affect multiple metrics on a report, see Create Filters.
To apply offset values such as "four months ago" to a metric, you add a transformation.
Click here for steps to add a transformation. You can add multiple transformations to the metric.Click Transformation in either the inner or outer formula.
In the Transformation area, click Add New.
Search for or navigate to the transformation to apply to the metric, then click Select.
For example, you can compare revenue numbers from this year to last year. While transformations are most often used for discovering and analyzing time-based trends in your data, not all transformations have to be time-based. For example, a transformation can map defunct product codes to new ones. For background information, see Transformation Metrics: Creating Time-Series Analysis.
-
You can format the metric's column headers and values. For steps, see Formatting Metrics.
-
You can set a variety of options, including selecting the functions that can be used to total the metric on a report, selecting the dynamic aggregation function, specifying joins, and setting VLDB properties such as null checking. For steps, see Applying Metric Options.
- Click Save.
- Click Save and Close.
Once you have created a metric, you can add the metric to a report, document, or dashboard to analyze your data. For steps, see Create and Edit Reports, Document Authoring, or Create a Blank Dashboard. You also use metrics when creating Create Filters and prompts (see Create an Object Prompt to Select Objects to Display on a Report and Create a Value Prompt to Select a Single Value).
Related Topics
-
Introduction to Metrics for a brief overview of metrics