Strategy One
Run a Dashboard in Presentation Mode
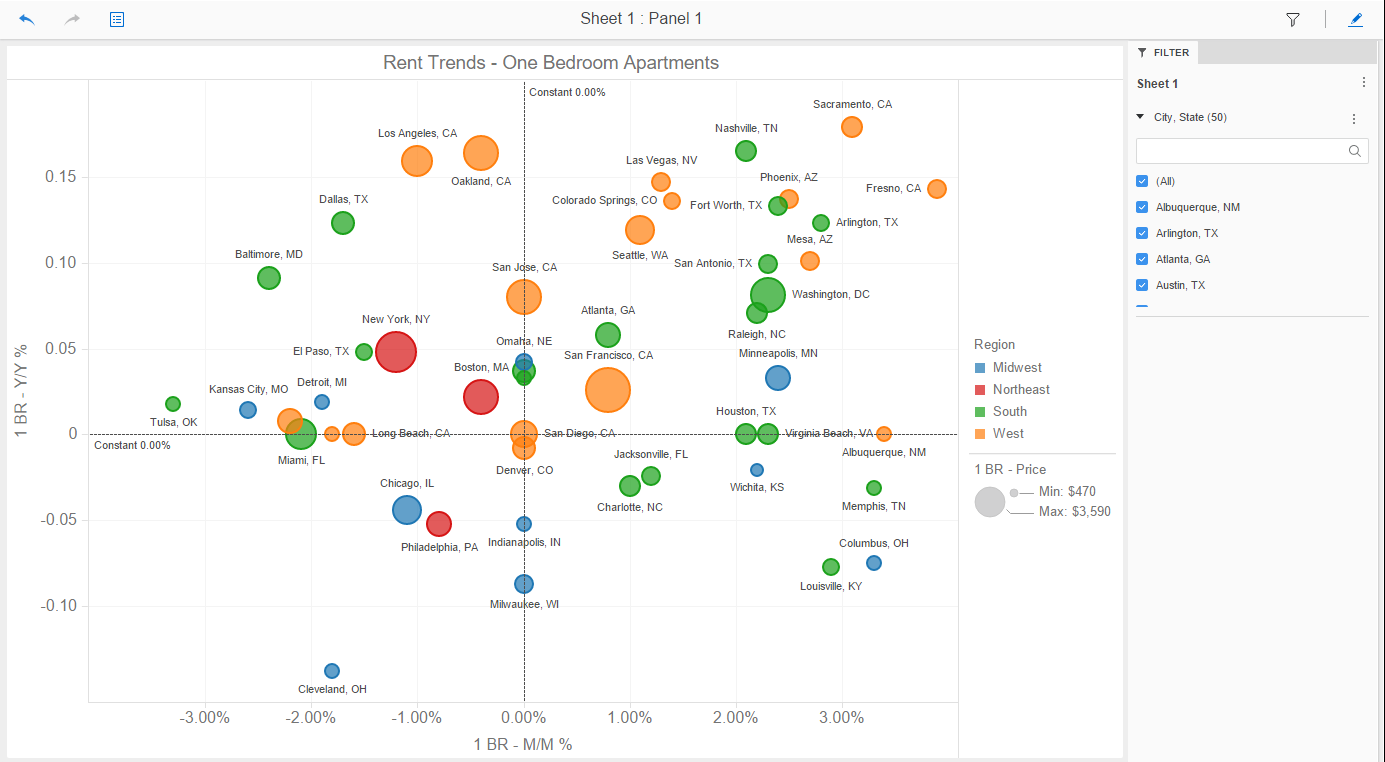
You can view a dashboard without having to see all the navigation features, such as toolbars, menus, and panels, that are available in the default interface. This allows you to maximize the amount of data that you can view at one time, while still allowing you to interact with your data. Right-click on data in presentation mode to view the available options.
If you created a filter on the Filter panel and the Filter panel was displayed in Edit mode, the Filter panel also displays in Presentation mode. Use the Filter icon  in the top right to hide and display the Filter panel in Presentation mode.
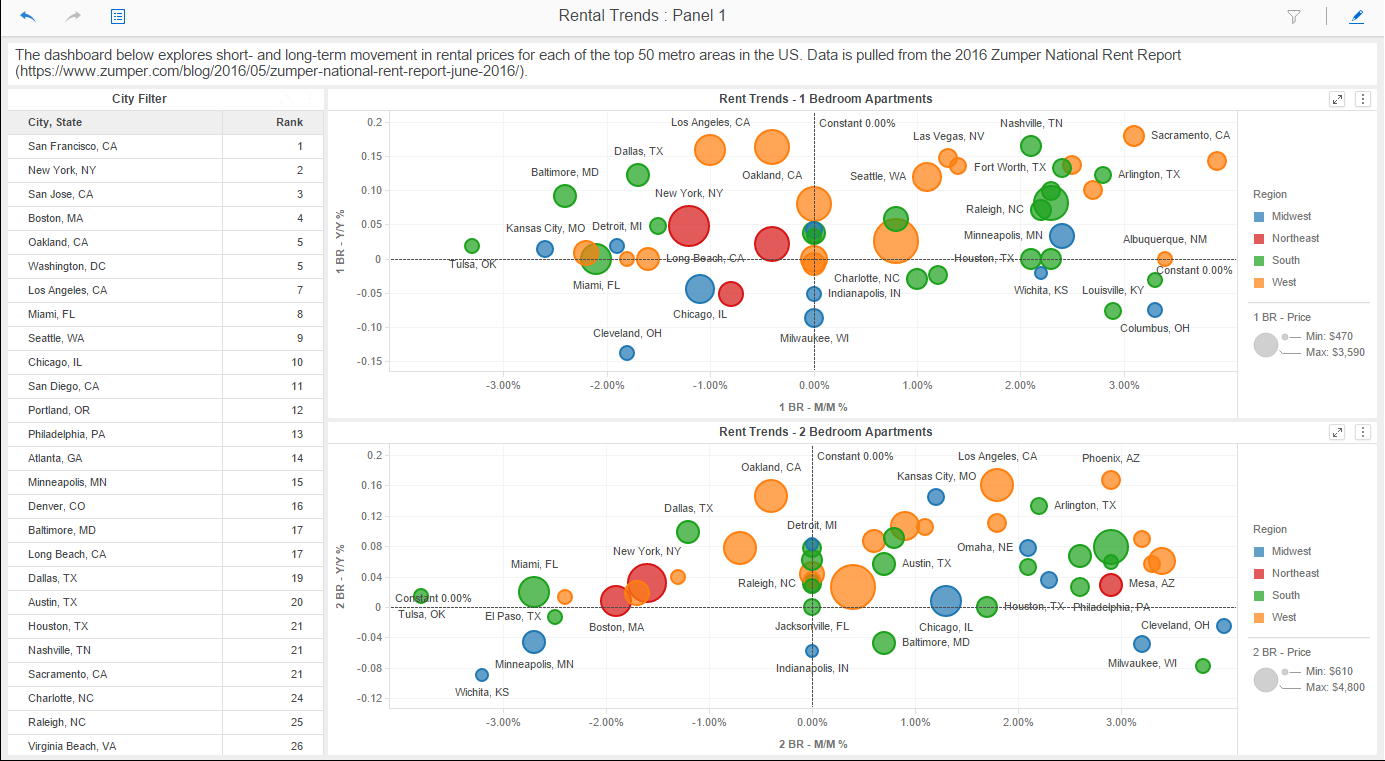
If you created a visualization that filters another visualization, you can use it as a filter. In the example, below, you can select a city in the City Filter visualization, which updates the Rent Trends bubble graphs to display data for only the selected city.
If the Contents panel was displayed in Edit mode, the Contents panel also displays in Presentation mode. Use the Table of Contents icon  in the top left to hide and display the Contents panel in Presentation mode.
Run a Dashboard in Presentation Mode
- Open a dashboard.
- In Workstation, click Presentation Mode
 in the toolbar.
 - Starting in Strategy One (September 2025), a new Dashboard Editor is available. If you have enabled it, click Presentation Mode
 in the toolbar.
- Starting in Strategy One (September 2025), a new Dashboard Editor is available. If you have enabled it, click Presentation Mode
- View and interact with the dashboard in Presentation mode. For example, you can change filter selections, navigate to different pages, and undo and redo actions.
- Press the ESC key to exit Presentation mode.