Strategy One
Introduction to Dashboards
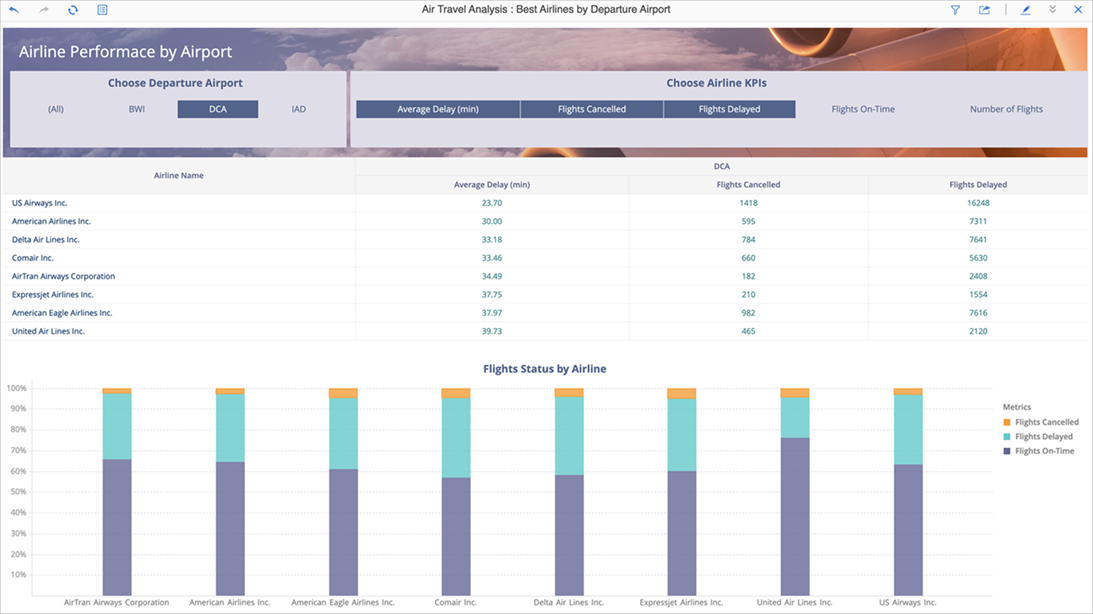
A dashboard is an interactive display that you can create to showcase and explore business data. You can add visual representations of the data (that is, called visualizations) to the dashboard to make your data easier to interpret, perform manipulations on the data to customize which information to display, and organize data into multiple chapters and pages to provide a logical flow to your dashboard. You can quickly and easily create a polished dashboard without requiring a lot of design time.
Perform the following tasks to build your dashboard:
- Add data to a dashboard by:
- Importing data from a file, database, or the results of a custom database query (that is, Freeform script)
- Adding Strategy reports, including intelligent cube reports and MultiDimensional Expressions (MDX) reports, from the current project or another project
- Creating a dataset report, containing existing project objects, within the dashboard
- Create visualizations, such as grids, KPIs, and bar charts, to display and interact with the data. See Introduction to Visualizations for more information about the available types of visualizations.
- Add other objects, such as text, images, and Web content to the dashboard.
- Create new attributes, metrics, and groups of attribute elements, based on existing objects, if the existing objects do not meet your needs or requirements.
- Drag and drop attributes and metrics to display data, create filters, group data, and more. You can also maximize the amount of space available for data display by viewing dossiers in Presentation Mode.

