MicroStrategy ONE
How to Add Filters to Your Dashboard
An intuitive filter panel makes it easy to screen data to see only the information that you need. You can filter data based on the values of any attribute or metric to change your view and better understand your data. Simple checkboxes, sliders, and radio buttons make filters easy to use and the impact of your selections is instantly visible.
The Filter panel limits the data that appears in the visualizations and text on the current chapter. Each chapter in the dashboard is represented by an entry in the Contents panel. Each chapter is a layer of data, with its own filtering criteria. Using chapter and filters allows you to create different views of data, using different visualizations and filters.

To add a filter:
-
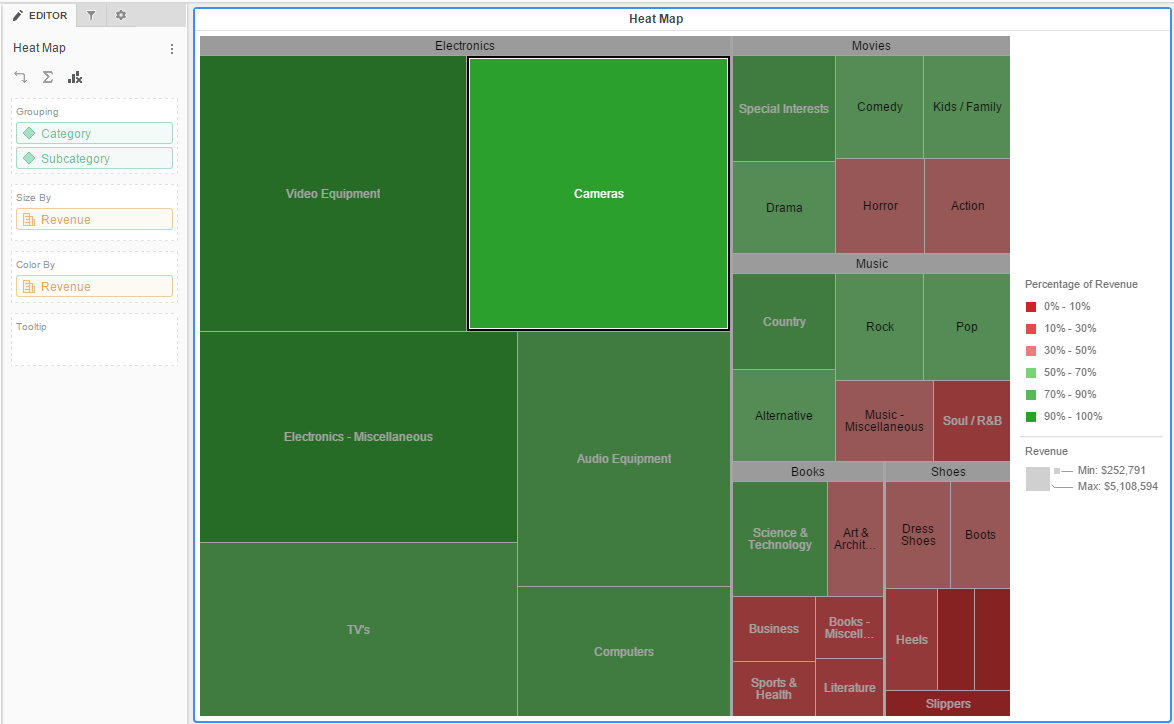
Open the dashboard with the heat map visualization you created in Create Your Heat Map Visualization.
- Select the heat map visualization.
-
Drag attributes or metrics from the Datasets panel to the Filter panel. Press and hold the Ctrl key to select multiple attributes or metrics.
The attributes and metrics appear as filters in the Filter panel. Attribute values appear with checkboxes, and metric values appear on a slider.
-
Click More
 next to the filter name and choose Display Style > [Style] to select a style for displaying the filter. See Filter Display Styles for more information.
To create an attribute filter, select the style for displaying the filter (that is, Slider, Search Box, Radio Buttons, etc.).
To create a metric filter, select Qualification to filter the metric values by comparing them to a specific value. Then, select a comparison operator (that is, Equals, Greater than, etc.) and enter a value in the filter.
- Metric filters can also be filtered based on the metric's rank. Click More
 next to the filter name and choose Qualify on Rank. Then select an operator (that is, Highest, Lowest, etc.) from the slider.
 - Check the box beside any filter to apply it and update the corresponding data in the visualization.
- Click More
 next to the filter name and choose Exclude to display data for all values except the selected ones.
 -
Click More
 next to the filter name and choose Disable Interactions in Library to prevent users from making selections to that specific filter when viewing in Library, Library Mobile, or the MicroStrategy application.
 Users must reset the dashboard to see the disabled filter interaction if the following scenarios are true:
-
If filter manipulations were saved to the bookmark prior to enabling the Disable Interaction in Library setting.
-
If filter manipulations were made to the source dashboard of a contextual link prior to enabling the Disable Interaction in Library setting.
Check out the video below to learn more!
-
Related Topics
Allow a Visualization to Update the Data in Another Visualization
Apply Dashboard or Chapter Filter Changes Individually or All at Once
Use Attribute Filters to Target Other Attribute Filters within a Chapter.
