Strategy ONE
Joining multiple datasets: Examples
The following examples show how datasets are joined.
-
Example 1: Same attributes in both datasets, different metric, and same filter (same element values). Result: Acts as one dataset. (See Example 1: Same attributes, same filter)
-
Example 2: Same attributes with different element values. Result: Acts mostly as one dataset, but missing values are blank. (See Example 2: Same attributes, different filter)
-
Example 3: Dataset with attributes that are a superset of attributes in other datasets. Result: All Detail is at a level combining all attributes. (See Example 3: Dataset with a superset of attributes that are in another dataset)
-
Example 4: Different attributes. Result: All Detail is at a level combining all attributes. (See Example 4: Different attributes)
Example 1: Same attributes, same filter
This example explains how a document behaves with multiple datasets that have the same attributes and the same report filter. The result is that the Detail, Group Header, and Group Footer sections behave as if the document has only one dataset.
Two sample dataset reports are executed as standard MicroStrategy reports displayed in grid view. Both datasets contain the same Region and Year attributes. Dataset 1 (the grouping and sorting dataset) contains the metrics Revenue and Units Sold, while dataset 2 contains the metric Profit.

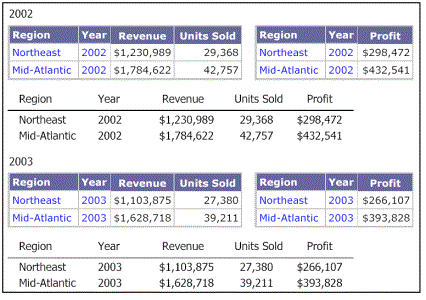
A document contains these two reports as datasets. When the document is executed, it creates a virtual dataset by joining the two datasets. In this case, because the attributes and the filter are the same, the result displayed in the Detail section has the same number of rows as the original reports, but it can display all three metrics together, as shown below.

You can also create a Grid/Graph that contains the attributes and metrics from the two datasets. The Grid/Graph would display the same four rows and data, as shown below:

You can create a Grid/Graph for each of the datasets, so that each Grid/Graph shows the data from its respective dataset, with no impact from the other datasets. For example, if we add Year to the Grouping panel and add a grid for each of the datasets to the Year Header, the grids display a summary of the year values, as shown below:
Example 2: Same attributes, different filter
This example explains the behavior of a document that contains multiple datasets having the same attributes but different report filters or prompt answers. The result is that the Detail, Group Header, and Group Footer sections behave as if the document has only one dataset, but with some data missing.
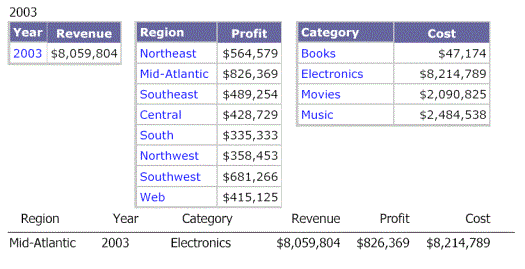
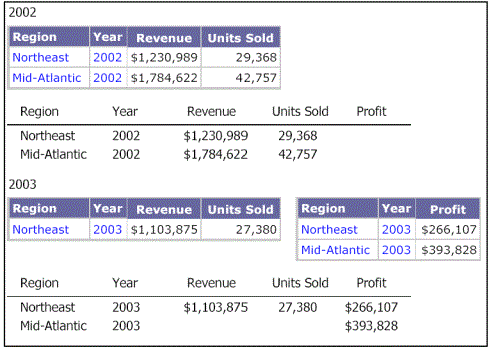
The following example has a document with two datasets. Dataset 1, which is the grouping and sorting dataset, has information for the Year 2002 and Dataset 2 has information for the Year 2003 because of the different filters or prompt answers. The Detail section displays a combination of both datasets and has empty cells where the data does not exist.


If you group by Year, you see the following:
Example 3: Dataset with a superset of attributes that are in another dataset
In a document, if the attributes in one of the datasets are a superset of the attributes in the other datasets, the Detail section of the document is at the same level as in the superset dataset.
For example, consider the following scenario:
-
Dataset 1, the grouping and sorting dataset, contains Region, Year, and Category.
-
Dataset 2 contains Region and Year.
-
Dataset 3 contains Region and Category.
The grouping and sorting dataset contains all of the attributes that are in the other datasets, so the grouping and sorting dataset contains a superset of the attributes in the other datasets.
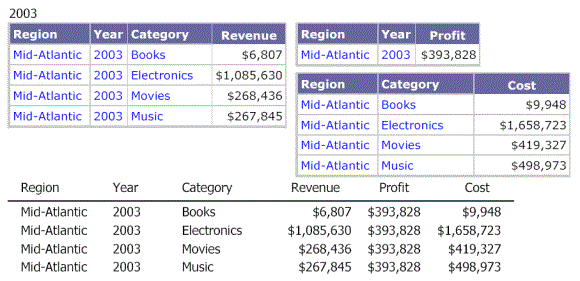
The following image shows the Revenue metric supplied by the grouping and sorting dataset for Region, Year, and Category. In this example, the following was selected for all three datasets:
-
Year: 2002 and 2003
-
Region: Mid-Atlantic
-
Category: All
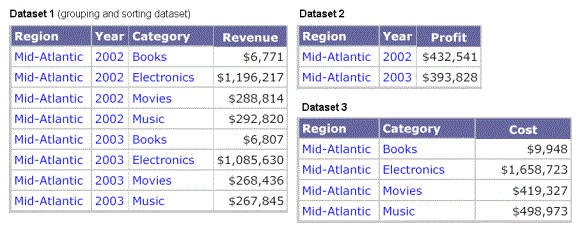
The Detail section of the document is calculated at the level of Region, Year, and Category with the metrics coming from the respective datasets. In this example, each metric comes from a different dataset. Since the Revenue metric is from the grouping and sorting dataset, it is calculated at the Region-Year-Category level. The Profit metric originated in Dataset 2, so it is calculated at the Region-Year level. Finally, the Cost metric is from Dataset 3 and is calculated by Region-Category. This is shown in the following image. Notice that there are eight rows in the Detail section—one row for each combination of Region, Year, and Category.
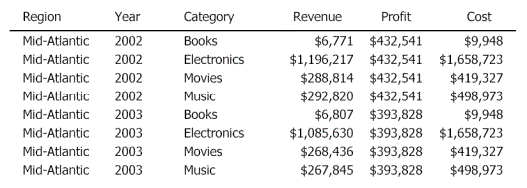
Metrics are never displayed at a level of greater detail than the level in the dataset report that they come from. The value for the Profit metric repeats for all four categories, because Dataset 2 contains only two values for Profit.
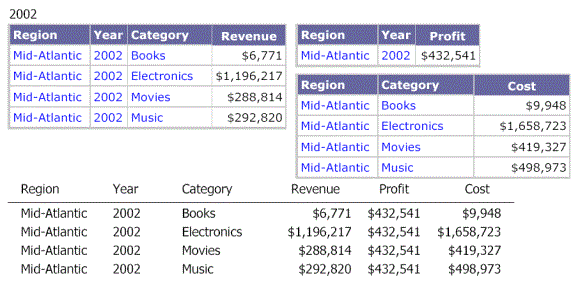
If you group by Year, you see the following:
Example 4: Different attributes
If the datasets in a document do not have any of the same attributes, the Detail section of the document represents a compound join of the attributes in all of the datasets.
For example, consider the following scenario:
-
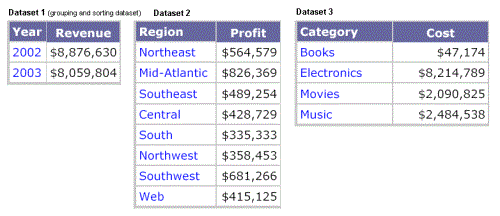
Dataset 1, the grouping and sorting dataset, contains Year
-
Dataset 2 contains Region
-
Dataset 3 contains Category
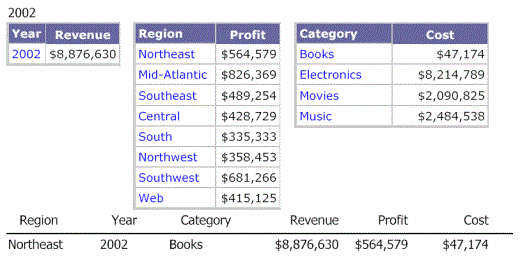
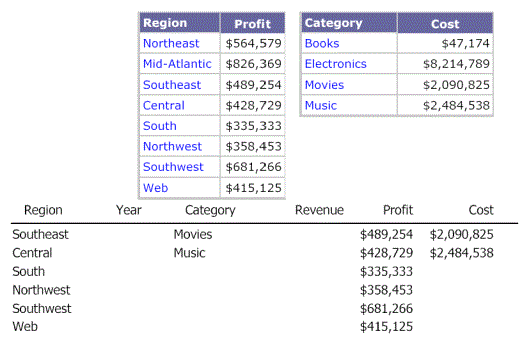
The datasets are shown below.
The Detail section is at the level of Region, Year, and Category with the metrics coming from the respective datasets. Because no relationship exists between the attributes, they cannot be joined in a meaningful way, as shown below.
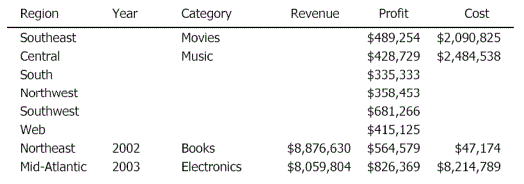
The "holes" in the data occur because metrics cannot be any more detailed than in their datasets. So, Revenue cannot be calculated for the South region because that level of granularity does not exist in the grouping and sorting dataset, which is the origin of the Revenue metric. Since the grids in this document are meaningful and predictable, they can be used for data reporting.
If the same document is grouped by Year, eight rows of data are still returned—one row for each Year, with the remaining six rows, which do not have a Year attribute, placed in a separate grouping section. Again, the data cannot be joined in a meaningful way because no relationships exist between the attributes.
