Strategy ONE
Working with multiple datasets
You can create a document with multiple datasets, and you can add more datasets after you create a document.
You can define the join behavior of each dataset as either primary or secondary. This functionality allows you to control which datasets determine the attribute elements that appear in the document results.
-
All of the elements from the primary datasets are displayed in the results.
-
Elements from the secondary datasets are displayed only if they also appear in a primary dataset.
These rules do not affect Grid/Graphs that use a single dataset report (the report that the Grid/Graph is based on). In this case, an element from a secondary dataset is displayed in a grid or graph report in a document even if it does not also appear in a primary dataset. If the Grid/Graph uses data from multiple dataset reports, the join behavior affects the content of the Grid/Graph. For more details on how join behavior affects Grid/Graphs, see Displaying Reports in Documents: Grid/Graphs.
Datasets are joined following these rules:
-
If a document contains one primary dataset, then all secondary datasets are joined to the primary dataset using left outer joins.
-
If a document contains at least two primary datasets, all primary datasets are joined using compound joins. The results are used to left outer join all secondary datasets.
-
If a document does not contain any primary datasets, all datasets are joined using inner joins.
For examples, see Defining a dataset as primary or secondary.
For a compound join, Intelligence Server joins the data in the datasets as described below:
-
If the datasets have any of the same attributes, the common attribute elements are matched.
-
Then, beginning with the first row of each dataset and continuing to the last, a row is created in a virtual dataset, which is the complete set of joined rows held in memory. The virtual dataset contains all attributes, consolidations, custom groups, and metrics. You can determine whether sections that do not have metric data are displayed and whether grouping elements that contain null values are displayed. For examples and instructions, see Displaying grouping elements that contain null values and Removing sections that do not have metric data.
The compound join saves memory space and processing time on the Intelligence Server executing the document. For examples of joining datasets, see Defining a dataset as primary or secondary and Joining multiple datasets: Examples.
When there are multiple datasets in a document, the grouping and sorting dataset is the one that is bolded in the Dataset Objects panel. A document can be grouped and sorted using fields from the primary dataset only.
A document can also pull data from any number of MDX cube, Freeform SQL, and Query Builder reports, which facilitate joining data across multiple sources. For details on these types of reports, see the MDX Cube Reporting Guide and the Advanced Reporting Guide.
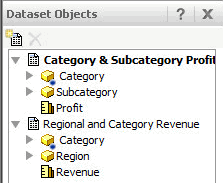
Any attributes common to multiple datasets are displayed with a blue icon in Dataset Objects. In the example below, the Category attribute is available in both the "Category & Subcategory Profit" dataset and the "Regional and Category Revenue" dataset:

When a document contains multiple datasets, a threshold or a view filter on a Grid/Graph can include any objects from any of the datasets, regardless of whether the Grid/Graph uses that dataset. Thresholds are special formatting that is automatically applied to data in a Grid/Graph, when the data meets a specified value. A view filter on a Grid/Graph places conditions on attributes and metrics which restrict the amount of data displayed on the Grid/Graph.
For example, a document contains a Regional Revenue dataset and a Regional Profit dataset. A Grid/Graph is created for the Regional Revenue dataset. Profit is not displayed on the Grid/Graph, nor is it in the data source for the Grid/Graph.
| • | In the Grid/Graph, you can create a threshold to change the formatting of the revenue amounts when the profit is greater than a specified amount. For a more detailed example, see Conditional formatting on a document with multiple datasets. For background information on thresholds in general, see Formatting conditional data in documents. |
| • | In the Grid/Graph, you can create a view filter to display only the regions with profits greater than a specified amount. For a more detailed example, see View filters in documents with multiple datasets. For background information on view filters in general, see Using view filters on Grid/Graphs. |
If a document contains multiple datasets and a selector, which items are displayed in a selector depends whether the selector filters or slices the data. A selector provides interactivity, allowing each user to change how he sees the data. When a user clicks a selector, a selector can change the focus of a grid or graph report or dynamic text fields (a text field that is a reference to an object on a report) in a panel stack.
| • | A slicing selector shows only the items available on the target. |
| • | A filtering selector shows all the items available in all the datasets. |
For example, a selector on Category targets a Grid/Graph that displays only Books and Movies. A second dataset on the document is filtered for Books and Music, but is not used on the Grid/Graph.
| • | If the selector is filtered, the selector displays Books, Movies, and Music (all the categories available in all the datasets). |
| • | If the selector is sliced, the selector displays Books and Movies (only the categories available on the target). |
For a more detailed example of filtering vs. slicing selectors on a document with multiple datasets, as well as general background information on selectors, see the Dashboards and Widgets Creation Guide.
Removing or keeping missing objects in a Grid/Graph when datasets are removed or replaced
If you remove or replace a dataset, controls on the document that contain data that is no longer available from the dataset will be updated and will no longer contain data from the replaced or removed dataset. For a Grid/Graph, objects that are available in another dataset are updated to contain data from the other dataset. Any missing objects can then be kept or replaced:
| • | If missing objects are kept, the headers for the missing objects are displayed in the Grid/Graph, without any data. |
| • | If missing objects are removed, the missing objects are not displayed in the Grid/Graph. If the Grid/Graph only contains missing objects, it is displayed as an empty placeholder. |
No matter whether missing objects are removed or kept, a text field that contains a dataset object (such as an attribute or a metric) will display the object name instead of values. For example, a text field displays {Region} instead of North, South, and so on.
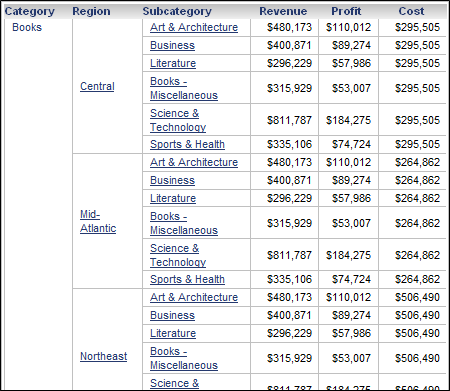
For example, a document contains two datasets. Dataset 1 has Category, Region, and the Revenue and Cost metrics. Dataset 2 has Category, Subcategory, and the Revenue and Profit metrics. A Grid/Graph displays Category, Region, Revenue, and Cost from Dataset 1, and Subcategory and Profit from Dataset 2. A part of this Grid/Graph is shown below:

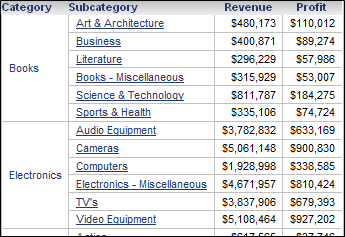
Dataset 1 is removed from the document. The Grid/Graph now displays Category, Subcategory, Revenue, and Profit from Dataset 2. By default, Region and Cost, which only exist in Dataset 1, have been removed. A part of the updated Grid/Graph is shown below:

You can instead allow objects missing from the source dataset to be displayed. The object name is displayed, but without any data. In the example above, the Region and Cost headers are displayed, as shown below:

If the document contains only one dataset, and it is removed, the Grid/Graph is displayed as an empty placeholder, because the document no longer contains any data. The missing objects behavior does not apply in this case.

MicroStrategy recommends that objects missing from datasets are displayed. This can alert you if objects are removed from a report used as a dataset. You can change this at the project or document level. Steps to change this behavior at the document level are provided below. For steps to change it at the project level, see Determining whether Grid/Graphs can use multiple datasets.
To determine whether missing objects are displayed or removed in a document
-
In MicroStrategy Web, open the document in Design or Editable Mode.
-
From the Tools menu, select Document Properties. The Properties dialog box opens.
-
From the left, select Advanced, under Document Properties.
-
From the Remove Missing Units drop-down list, select one of the following:
-
To use the project-level property, select Inherit value from project-level setting.
-
To remove unavailable objects, select Remove objects not available in the source datasets.
-
To display unavailable objects, select Do not remove objects not available in the source dataset.
-
-
Click OK to save your changes and return to the document.
