Strategy ONE
Displaying Reports in Documents: Grid/Graphs
Introduction
In a document, you can display a report by adding a Grid/Graph to the document. A Grid/Graph acts as a standard MicroStrategy report.
Once a Grid/Graph is in the document, you can display it in several ways:
-
Grid: Displays the Grid/Graph as a standard MicroStrategy grid report with rows and columns of attributes and metrics, as shown below. For details, see Viewing a Grid/Graph displayed as a grid.

-
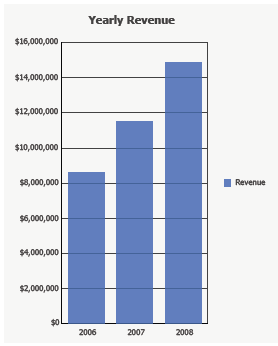
Graph: Displays the data visually like a standard MicroStrategy graph report, as shown below. For details, see Viewing a Grid/Graph displayed as a graph.

-
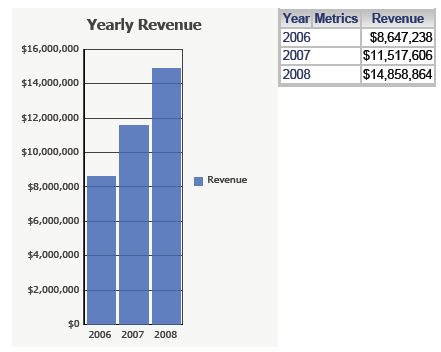
Grid and Graph: Displays both grid and graph reports simultaneously, as shown below. For details, see Viewing a Grid/Graph as a grid and a graph at the same time.

You can use a Grid/Graph as a type of summary for a group or the entire document, because the data displayed in it is aggregated to the level of the document section in which the Grid/Graph is placed. If the Grid/Graph is in one of the Group Header or Group Footer sections, it limits the data displayed in it to only that which is included in that group.
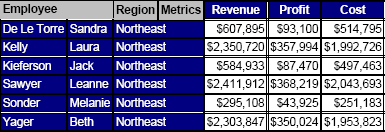
For example, a document is grouped by Region, and you place a Grid/Graph in the Region Header section. If Region contains three values (Midwest, Northeast, and Northwest), the Grid/Graph aggregates and displays only Midwest data in the Midwest Region Header, only Northeast data in the Northeast Region Header, and only Northwest data in the Northwest Region Header. The following sample Grid/Graph is for the Northeast region.

You can use a Grid/Graph to display a subset or view report, which is a report containing objects that are part of the report's definition but are not displayed on the grid or graph. For details, see Using a view report or base report as a dataset.
This chapter describes how to add Grid/Graphs to documents and how to work with them:
