Strategy One
Add a Report Filter
A report filter applies to the data in your data source, restricting how much data is retrieved from the data source. Report filters are used in the SQL that is generated to retrieve data from the data source.
You can add a report filter by:
- Adding a stand-alone filter, if a filter object has already been created in your project that meets your filtering requirements. For steps, see Add a Stand-Alone Filter to a Report below.
- Creating a filter directly in the report. This kind of filter cannot be used as a filter on other reports. For steps, see Create a Filter Within a Report below.
Both types of filters accomplish the same results in a given report. The difference is that a stand-alone filter can save you time, because it can be reused on multiple reports. This is especially useful if your report users require common subsets of data for many reports. For example, if most of your users only need to see results for your Northeast region for the current year, you can create a filter with the Northeast attribute and the current year attribute in it. When you add that filter to all reports, only data related to the Northeast region for the current year displays.
You can Remove a Report Filter.
Add a Stand-Alone Filter to a Report
You can also add a report or a prompt to use a filter as well.
The results of an existing report can be used as a filter for another report. You can also use a report as a filter and then add additional qualifications to expand the overall filter definition. For examples, see Filtering data based on report results: Shortcut-to-a-report qualification.
-
Open the report to filter. In the Navigation pane of Workstation, click Reports. Search for or navigate to the report. Double-click the report.
-
Click Filter
 to display the Filter panel.
-
In the Objects panel, search for or navigate to the stand-alone filter, report, or prompt. Drag the object to the Filter panel.
-
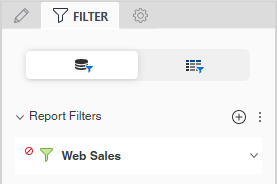
You can add NOT to the filter so that the report returns everything that doesn't match the filter condition. To do this, click the menu icon to the left of the filter and select the NOT check box.
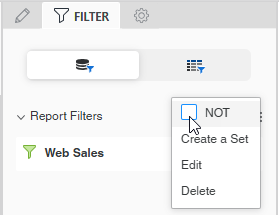
Now the filter returns everything except Web sales.
-
You can add more stand-alone filters or Create a Filter Within a Report.
-
Change the order that the filters are evaluated. In the Filter panel, click and drag a filter to another location.
-
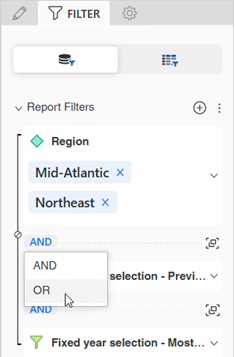
Change the operator that joins the filters. By default, all filters are joined with the AND operator, meaning that data must meet all filters to be included in the report. To change the operator to OR, meaning that data must meet only one of the filters to be included, click AND and select OR.
-
Add NOT to the operator, by clicking the not icon
 between the filters. This means that the report returns everything that doesn't match the filters. In the example below, the report displays the Books category and Northeast region values.
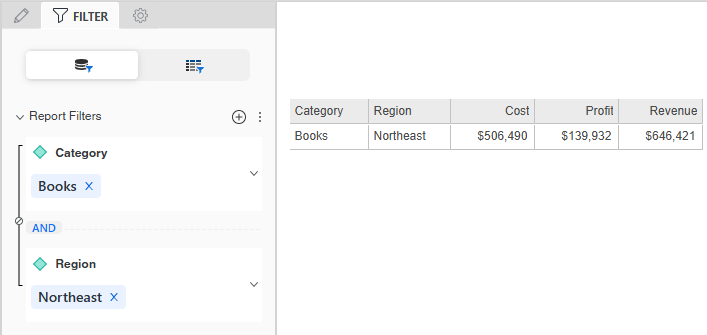
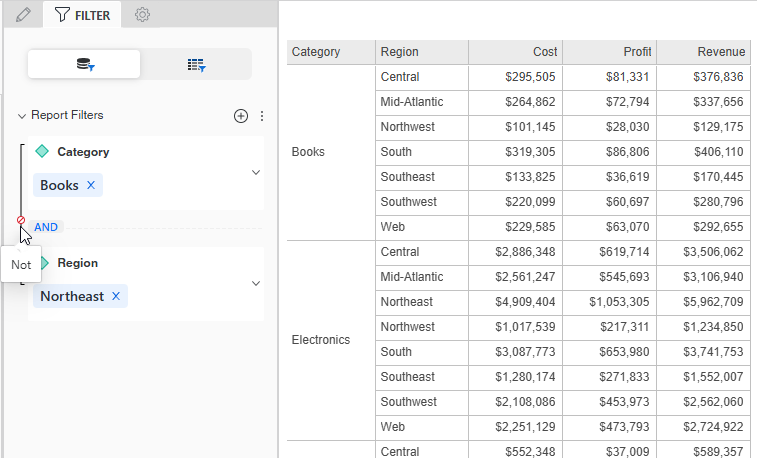
After NOT is added, the report displays all the categories except Books and all the regions except Northeast. A report sample is shown below.
-
-
Group filters to be evaluated together by clicking Group
 .
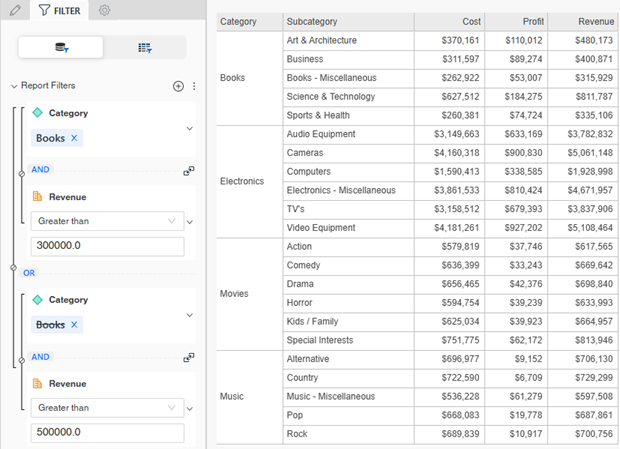
.For example, you want to filter the Books category at a different revenue value than the other categories on the report. Create a filter for Category = Books and another for Revenue greater than 300,000. Group those filters together. Create a filter for Category not Books and another for Revenue greater than 500,000. Group those filters together. Be sure to change the operator between the two groups to OR, instead of the default AND.
-
To view the results, click Resume Data Retrieval
 .
. -
If the filter is prompted, the Prompt page displays. Answer the prompt and click Run.
-
The report displays with data retrieval paused.
If you add multiple filters, whether stand-alone or in-report, you can:
If you add another filter while data retrieval is active, click Apply to apply the new filter.
Create a Filter Within a Report
When you create a filter within a report, you can base it on any object in your data source, whether or not the object is included on the report. You can also create a custom expression or a prompt to use as the filter.
-
Open the report to filter. In the Navigation pane of Workstation, click Reports. Search for or navigate to the report. Right-click the report and select Edit.
-
Click Filter
to display the Filter panel.
-
In the Objects panel, search for or navigate to the object to filter the report by. If the report already contains the object, click In Report to view the objects on the report.
-
To create a custom expression or prompt instead, click the Add button
 next to Report Filters. From the Based On drop-down list, select Custom Expression or Create Prompt. Create the custom expression or prompt. Continue these steps here.
-
-
Drag the object to the Filter panel.
-
Define the filter condition, such as Region = Northeast or Revenue Greater than 1,000. The definition options vary depending on the type of object you added to the filter.
-
If you are filtering based on an attribute, you can qualify on the attribute elements in a list or create an attribute form qualification.
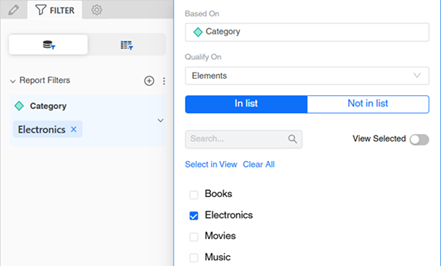
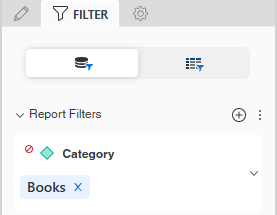
- By default, the filter qualifies on the attribute elements in a list. You can select Not in List instead. Select the check boxes for the elements to include or exclude. For example, the filter definition below includes the Electronics category in the report.
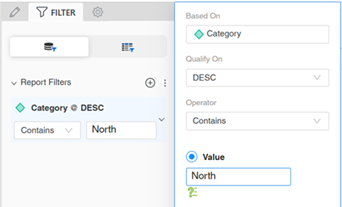
- You can instead qualify on an attribute form, which compares a selected attribute form (such as ID or Description) to a specific value. For example, the filter definition below includes Category descriptions that contain the value North on the report. For steps, see Filter Data Based on Attribute Forms: Attribute Form Qualification.
-
If you are filtering based on a metric, you create a qualification based on metric values, rank, or percentage. For steps, see Filter Data Based on a Metric .
-
-
You can add NOT to the filter so that the report returns everything that doesn't match the filter condition. To do this, click the menu icon to the left of the filter and select the NOT check box.
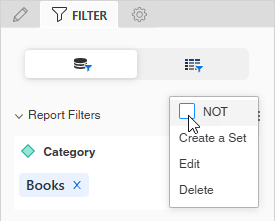
Now the filter returns all categories except Books.
-
You can create more filters or Add a Stand-Alone Filter to a Report.
-
Change the order that the filters are evaluated. In the Filter panel, click and drag a filter to another location.
-
Change the operator that joins the filters. By default, all filters are joined with the AND operator, meaning that data must meet all filters to be included in the report. To change the operator to OR, meaning that data must meet only one of the filters to be included, click AND and select OR.
-
Add NOT to the operator, by clicking the not icon
between the filters. This means that the report returns everything that doesn't match the filters. In the example below, the report displays the Books category and Northeast region values.
After NOT is added, the report displays all the categories except Books and all the regions except Northeast. A report sample is shown below.
-
-
Group filters to be evaluated together by clicking Group
.For example, you want to filter the Books category at a different revenue value than the other categories on the report. Create a filter for Category = Books and another for Revenue greater than 300,000. Group those filters together. Create a filter for Category not Books and another for Revenue greater than 500,000. Group those filters together. Be sure to change the operator between the two groups to OR, instead of the default AND.
-
To view the results, click Resume Data Retrieval
. -
If the filter is prompted, the Prompt page displays. Answer the prompt and click Run.
-
The report displays with data retrieval paused.
If you add multiple filters, whether stand-alone or in-report, you can:
If you add another filter while data retrieval is active, click Apply to apply the new filter.
Filter Data Based on Attribute Forms: Attribute Form Qualification
Use these steps to define an attribute form qualification in your in-report filter.
-
After dragging an attribute to the Filter panel, from the Qualify On drop-down list, select the attribute form to filter data on.
-
From the Operator drop-down list, select the operator that describes how you want to filter data, such as Begins With or Less Than.
-
Define the value that will be compared against the data in your data source. You can:
- Use a static, specified value. Type
the Value. Depending on the operator
that you selected, you
may need to type multiple values. For example, the operator
Between requires two values. The filter definition below includes Category descriptions that contain the value North on the report.
- If you filter based on a date or time attribute, such as ship date or invoice date, you can compare it to a dynamic date. A dynamic date is a date that is a fixed offset from the current date. For steps, see Define a Dynamic Date.
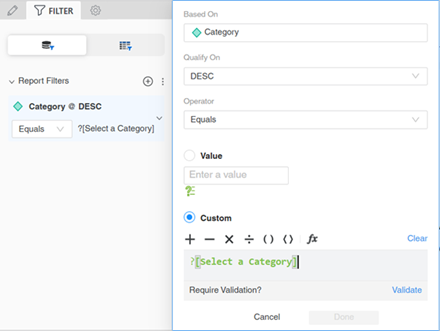
- Use a prompt to allow users to select the value. Drag and drop a value prompt from the Objects pane to the Custom area. The value prompt can be a text prompt or a date prompt. Click Validate. For example, the filter definition below prompts users to select a category to include on the report.
- Create a prompt that asks the user for the value. Click Create
Prompt
 . You can change the prompt's title and instructions, answer restrictions, and default answer, by clicking each component. The answer restrictions are the minimum and maximum number of prompt answers, whether the prompt answer is required, and whether to allow personal answers. Click Done. For background information on value prompts, see Create a Value Prompt to Select a Single Value.
- Use a static, specified value. Type
the Value. Depending on the operator
that you selected, you
may need to type multiple values. For example, the operator
Between requires two values. The filter definition below includes Category descriptions that contain the value North on the report.
- Return to creating the filter at this step.
Filter Data Based on a Metric
Use these steps to define a metric qualification in your in-report filter.
-
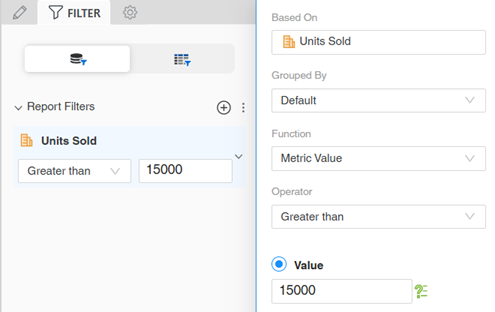
After dragging a metric to the Filter panel, from the Function drop-down list, select whether to filter the metric on Metric Value, Rank, or Percentage.
-
From the Operator drop-down list, select the operator that describes how you want to filter data, such as Equal To or Less Than.
-
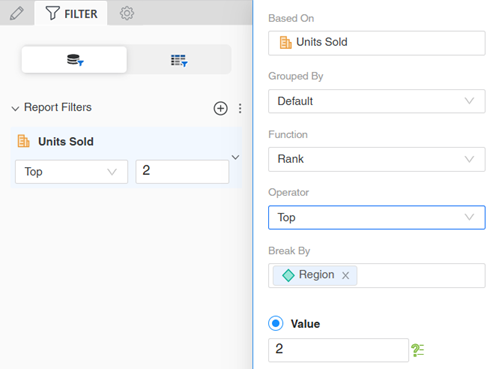
If you are filtering by rank or percentage, you can select the level to restart counting. Search for an attribute in the Break By box or drag an attribute from the Objects pane to the Break By box. The filter definition below includes the top two Units Sold values in each region.
-
Define the value that will be compared against the data in your data source. You can:
- Use a static, specified value. Type the Value. Depending on the operator that you selected, you may need to type multiple values. For example, the operator Between requires two values. The filter definition below includes Units Sold values greater than 15,000.
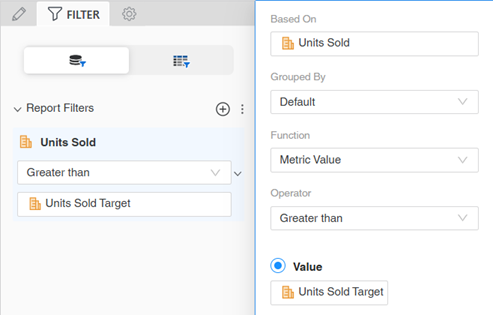
- Use another metric. Drag and drop a metric from the Objects pane to the Value box. For example, the filter definition below includes Units Sold values that are greater than the Units Sold Target values.
- Use a prompt to allow users to select the value. Drag and drop a value prompt from
the Objects pane to the Custom area. The value
prompt can be a numeric prompt, long prompt, or Big
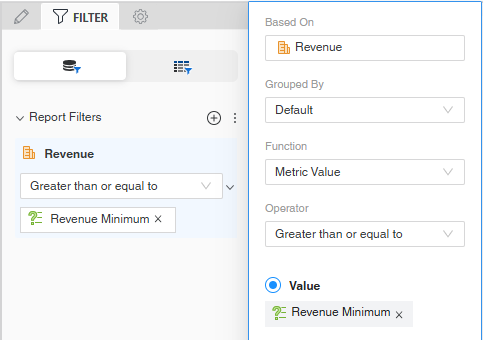
Decimal prompt. Click Validate. For example, the filter definition below prompts users to type a value that is used as the minimum Revenue value to include on the report.
- Create a prompt that asks the user for the value. Click Create
Prompt. You can change the prompt's title and instructions, answer restrictions, and default answer, by clicking each component. The answer restrictions are the minimum and maximum values, whether the prompt answer is required, and whether to allow personal answers. Click Done. For background information on value prompts, see Create a Value Prompt to Select a Single Value.
-
You can define the attribute level that the metric is calculated at. You can change the calculation level to:
-
Attributes defined in the metric
- Attributes in the report template (the lowest level attribute on the report, not just displayed on the report grid)
-
Selected attributes
-
- Return to creating the filter at this step.
Remove a Report Filter
-
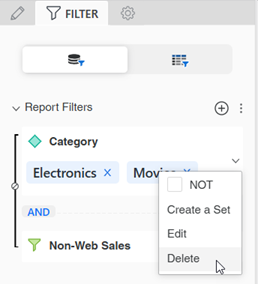
To remove a single report filter, click the more icon
 for the filter and select Delete.
 -
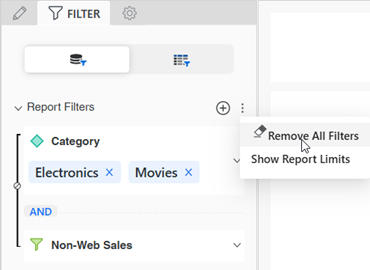
To remove all the report filters, click the menu icon
 next to Report Filters and select Remove All Filters.
 -
If data retrieval is active, click Apply to remove the filters.