Strategy One
Create Intelligent Cube Reports
Starting in Strategy One (December 2025), you can replace cubes in reports that use intelligent cubes.
Beginning in Strategy One (December 2025), you can filter cube reports using prompts. You can add an existing prompt directly to the report's view filter, or you can create an embedded prompt within the view filter.
-
A prompt is a question the system presents to a user when a report is executed. How the user answers the question determines what data displays on the report.
-
View filters apply to the report results after the data is returned from the data source. In cube reports, you can create view filters to modify the report's results. The cube itself can contain filters that restrict that cube's data available to the report.
MicroStrategy 2021 Update 9 introduces the ability to create intelligent cube reports based on an Intelligent cube.
You can perform all of your reporting and data analysis requirements within an intelligent cube without executing against the data warehouse. Once an intelligent cube is created and then published so its data is available, multiple reports can be created to connect to the intelligent cube.
Reporting on a shared intelligent cube provides quick access to data as the data has been pre-aggregated. This returns report results much faster than querying the data warehouse. Reports that connect to an intelligent cube are restricted to only the data available within the intelligent cube. This ensures that report results are returned quickly, and it also prevents full ROLAP analysis. Report filters, consolidations, and custom groups are not available for reports that connect to intelligent cubes.
To create or edit intelligent cube reports you must at least have the following privileges:
-
Web define Intelligent Cube Report or Defined Intelligent Cube Report
-
Create Schema Objects
The Modeling service must be configured correctly to use this feature. This is the same requirement to create or run a static report in Workstation.
Create an Intelligent Cube Report
-
Open the Workstation window and connect to an environment.
-
Navigate to the previously saved intelligent cube on which you want to build your report.
-
Right-click the cube, point to New, and choose Intelligent Cube Report from....
A blank report displays in Edit mode, with data retrieval paused for improved performance when working with large datasets. When data retrieval is paused, results do not display. To view the results, click Resume Data Retrieval
 . To pause data retrieval, click Pause Data Retrieval
  .
. -
In the Report Objects panel, search for or navigate to each of the objects to display on the report and do one of the following:
-
Drag it to the drop zone in the Editor panel where you want it to display.
-
Double-click the object to add it automatically.
Attributes are automatically added to the rows of the report, although you can drag and drop them into the columns.
Metrics are automatically displayed in the columns and placed in the Metrics drop zone of the Editor panel.
-
-
When you add a metric, the Metric Names object is automatically created and displayed in the Columns drop zone. This object determines where and how metrics display.
-
To display each metric in a column, with the metric name as the column header, keep the Metric Names object in the Columns drop zone.
-
To display each metric as a row, with the metric name in the row, drag Metric Names to the Rows drop zone.
-
-
You can add object prompts to the grid from the Prompt panel. The prompt should be related to an attribute or metric contained in the report. For example, a report on a customer data cube can use a prompt that allows users to choose customer names. If data retrieval is on, the prompt is displayed for you to answer.
-
Object prompts provide users the ability to add objects to a report. The objects the user selects in the prompt are placed on the report. This essentially allows users to create their own customized reports, although you use the object prompt to control what objects they can choose to include on their reports.
-
-
Filter the report to ensure that it contains the correct data and focuses on your intended analysis. To filter the report:
-
Click Filter
 to display the Filter panel. Any filters included in the cube display on the Cube Filter tab. They are not editable because they are included in the cube.
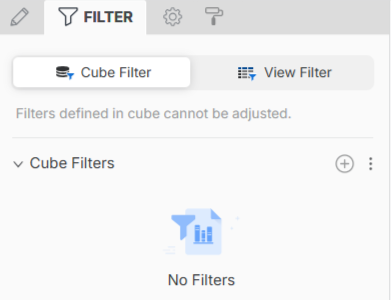
-
Click View Filter to display the View Filter tab. You can:
-
If data retrieval is on, click Apply. Any prompts display for you to answer, then the report results display.
-
-
To see the report results, in the toolbar, click Resume Data Retrieval
. Answer any prompts. Save the Report
-
Click Save.
-
Type the report's name in the Save As box.
-
Navigate to the location to save the report in.
-
Click Save.
-
Starting in Strategy One (July 2025), optionally type a description in User Comments and click OK.
After you save, data retrieval is again paused.
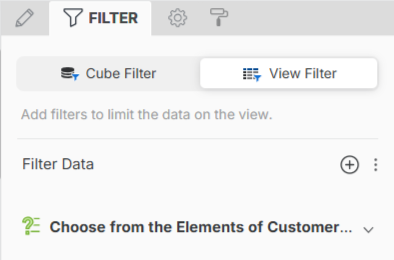
Create a View Filter
-
In the View Filter tab on the Filter panel, click Add
 .
. -
From the Based On drop-down list, select the object (attribute or metric) on which you want to base your filter.
- Define the filter condition, such as Region = Northeast or Revenue Greater than 1,000. The definition options vary depending on the type of object
you added to the filter.
- If you are filtering based on an attribute:
- By default, the filter qualifies on the attribute elements in a list. You can select Not in List instead. Select the check boxes for the elements to include or exclude. For example, the view filter definition below displays the Northeast and Northwest regions in the report. Instead of selecting elements, you can create a prompt that asks users by clicking Create
Prompt
 . For steps to create an attribute element list prompt, begin at this step.
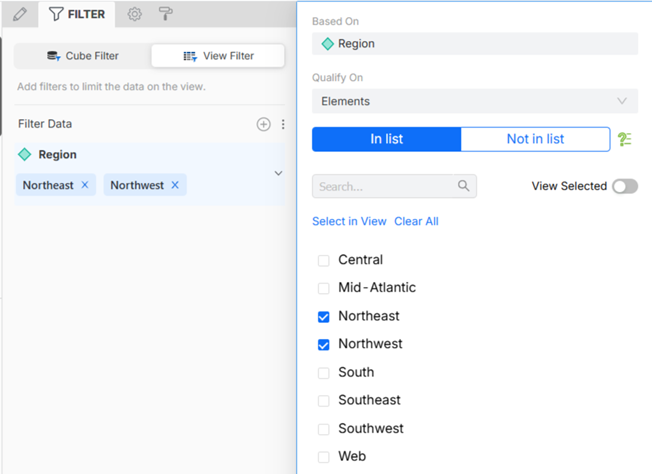
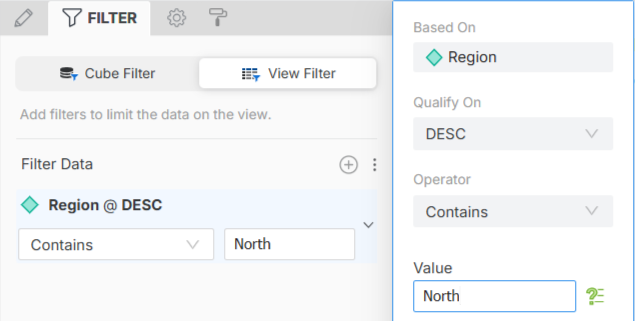
- You can instead qualify on an attribute form, which compares a selected attribute form (such as ID or Description) to a specific value.
From the Qualify On drop-down list, choose the attribute form to filter on.
From the Operator drop-down list, select a comparison operator such as Does Not Equal or Contains.
Type the Value to compare the attribute element to. Instead of typing a value, you can create a prompt that asks users by clicking Create Prompt
. For steps to create a value prompt, begin at this step.If you filter based on a date or time attribute, such as ship date or invoice date, you can compare it to a dynamic date. A dynamic date is a date that is a fixed offset from the current date. For steps, see Define a Dynamic Date.
Click here to view steps to create the attribute form qualification.For example, the filter definition below displays Region descriptions that contain the value North on the report.
- By default, the filter qualifies on the attribute elements in a list. You can select Not in List instead. Select the check boxes for the elements to include or exclude. For example, the view filter definition below displays the Northeast and Northwest regions in the report. Instead of selecting elements, you can create a prompt that asks users by clicking Create
Prompt
If you are filtering based on a metric, create the filter definition.
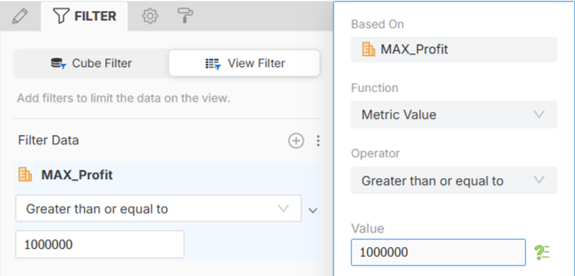
Click here to view steps to create the filter definition.From the Function drop-down list, select whether to filter the metric on Metric Value, Rank, or Percentage
From the Operator drop-down list, select a comparison operator such as Does Not Equal or Contains.
If you are filtering by rank or percentage, you can select the level to restart counting. From the Break By drop-down list, select the attribute level.
Type the Value to compare the metric value to. Instead of typing a value, you can create a prompt that asks users by clicking Create Prompt
. For steps to create a value prompt, begin at this step.
For example, the filter definition below displays MAX_Profit metric values greater than or equal to 1,000,000 on the report.
- If you are filtering based on an attribute:
- Click Done to complete the condition.
Attribute conditions are listed under View Filters, while metric conditions are listed under Aggregation Filters. In the example below, Subcategory, an attribute condition, displays as a view filter, while Profit, a metric condition, displays as an aggregation filter. By default, the metric in a view filter condition calculates at the level of the attributes displayed on the report grid, although you change it to calculate at the level of all the objects on the report. To change it, Click the more icon
 for the filter and select Use as Aggregation Filter.
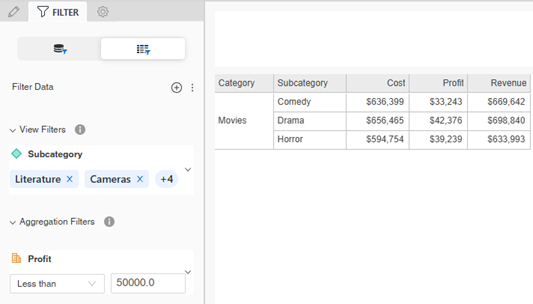
-
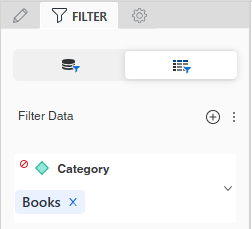
You can add NOT to the filter condition so that the report returns everything that doesn't match the filter condition. To do this, click the menu icon to the left of the filter and select the NOT check box.
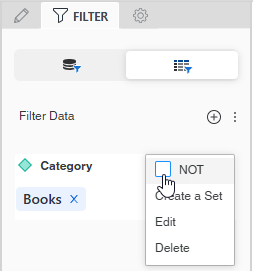
Now the filter returns everything except the Books category.
- You can create more filter conditions to further refine the report display.
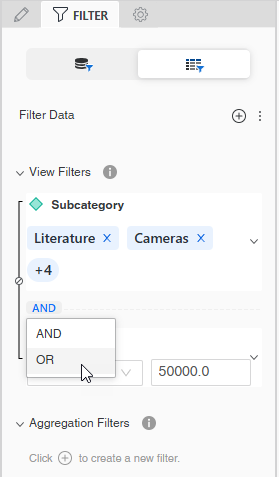
If you add multiple filters, whether stand-alone or in-report, you can:
Change the order that the filters are evaluated. In the Filter Data panel, click and drag a filter to another location.
Change the operator that joins the filters. By default, all filters are joined with the AND operator, meaning that data must meet all filters to be included in the report. To change the operator to OR, meaning that data must meet only one of the filters to be included, click AND and select OR.
- Add NOT to the operator, by clicking the not icon
 between the filters. This means that the report returns everything that doesn't match the filters.
-
To apply the view filter, click Apply.
Replace Datasets in Reports
You can replace datasets in reports using intelligent cubes.
-
On the Workstation homepage, open the intelligent cube report you want to edit.
-
In the Report Objects panel, select More Options and click Replace Cube....
-
A prompt displays to select an existing dataset.
-
After making the selection, a prompt will display to replace, remove or keep objects currently used in the grid.
An error message will display if there are differing objects between the two datasets. You must choose whether to replace or remove the objects.
-
Click OK after making your selections. You will now see the updated dataset.
Known limitations in MicroStrategy 2021 Update 9:
-
Derived element creation inside the report is not yet available in Workstation.
-
Creating an intelligent cube report within Library is not yet available, although you can edit an existing cube report in Library.