Strategy ONE
Response Structure
Beginning in Strategy One (March 2025), bots have been enhanced to improve responses and the bot creation process. For more information on the enhancements, see Strategy One (March 2025) Enhancements.
-
You can continue to create bots, as well as edit and use bots created in previous versions. For an introduction, see Auto Bots: Customized Stand-Alone Bots (prior to March 2025).
-
To enable the new bots, contact Strategy support. For an introduction to the new bots, see Auto Bots: Customized Stand-Alone Bots. For steps to create a new bot, see Create a Bot.
Understanding the Response
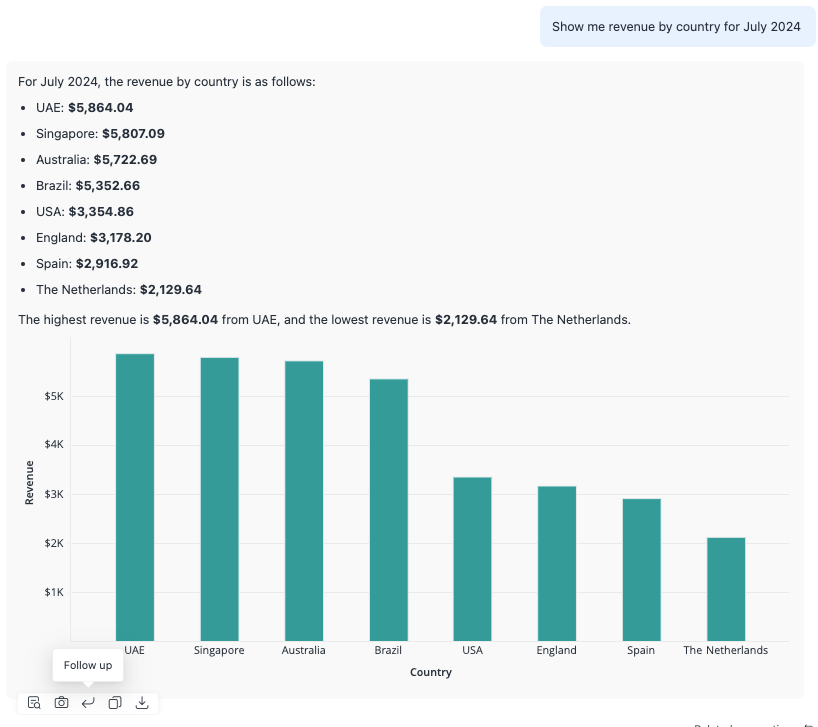
Bot responses are comprised of natural language text and visualizations. Bots support a range of visualization types. If you ask a question that requires specific visualizations, ensure that the chosen visualization type is one of the following supported types:
- Grid
- Vertical bar chart
- Pie chart
- Line chart
- KPI
- Heat map
- Geospatial service (Mapbox)
- Key driver analysis
- Insight line chart for trend and forecasting analysis
- Starting in MicroStrategy ONE (June 2024):
- Bubble chart
- Horizontal bar chart
- Clustered bar chart
Only one metric is supported.
Ring chart is not supported.
Some line chart subtypes are not supported.
Attributes are not supported.
The response is accompanied by a navigation panel, which becomes visible in the bottom left corner when you hover over the response. You can:
-
Request Leverage AI Interpretation
-
Add a response to the My Snapshots Panel so you can refer to it later
-
Follow up to ask further questions related to the initial answer, enabling you to drill deeper into the data
-
To copy an answer:Hover over the bottom of the answer.Click More.Choose Copy as Image. as an image
-
To download the answer as an image file:Hover over the bottom of the answer.Click More.Choose Download.as a PNG image file
Business users can also ask follow-up questions directly without needing to click the follow-up icon. In this scenario, Auto automatically considers multiple recent questions and answers to provide context for the new query.
Response Limitations
Responses include the following limitations:
- The bot displays only the most recent 30 messages.
-
If the response includes many data points, the visualization displays limited data (up to 1,000 rows) to focus on clarity and readability.
-
The maximum size of a visualization is 50 MB (around 10 MB post-compression).
-
A visualization that exceeds 200M is not displayed once you reopen the bot.
-
-
External storage is limited to 2 TB.
-
Updates to themes in the Appearance panel are not applied to previous visualization results.