MicroStrategy ONE
Steps to apply a pattern to a graph object
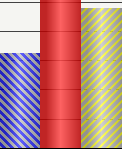
Patterns can help to distinguish between different series risers in a graph without having to rely solely on color. For example, the three bar risers shown below can be distinguished by color as well as by the pattern they use.
To apply a pattern to a graph object
-
Open a report. (How?)
-
If the report is not already in Graph view, from the View menu, select GraphView to display the report as a graph.
-
Right-click a graph object such as a riser, marker, graph frame, legend, and so on, and select Formatname of object from the right-click menu. This option is named differently, depending on the object you select. For example, for a line in a line graph, this option is named Format Data Marker. The Preferences dialog box opens.
-
Click the Fill category. For information on the different options on this category and how you can modify the line of an object, see Fill formatting for graph objects.
-
From the Background type drop-down list, select Patternto display pattern formatting options.
-
From the Foreground drop-down list, select a color for the foreground of the pattern. The Preview window displays your selections immediately.
-
From the Background drop-down list, select a color for the background of the pattern. The Preview window displays your selections immediately.
-
Click OK to apply the pattern to the currently selected object and return to the graph.