MicroStrategy ONE
Adding an object to a graph report
As you work with a MicroStrategy graph report, you may need to analyze data currently not on the report. In such cases, you must add objects to the grid report so that the graph report is changed accordingly.
For example, you have a grid report that provides data about the yearly cost of medical supplies. Your district manager wants to view this data graphically. Moreover, she is interested in seeing this data at the month level, as well as the year level already available on the report.
You can add data to a report by using the Object Browser to add attributes, metrics, consolidations, and other objects.
Since your manager wants to view the report at the month level, you might choose to add the Month attribute to your cost of medical supplies report. The procedure below guides you through adding an object to a graph report.
Some graph styles accommodate more report data than others, as explained in Minimum object requirements for each graph style. Therefore, in some cases, adding report objects to a report may limit the graph styles you can use to present data effectively. Look at the table in Minimum object requirements for each graph style to select a graph style that can accommodate the number of objects on your report. Experiment with different graph styles until you find one that works best for your specific data.
To add an object to a graph report
-
If a report is not already in Design view, from the View menu, select Design View.
-
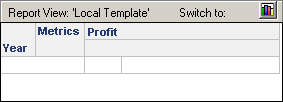
From the Object Browser, navigate to attributes and metrics to add to the graph report. Add at least one attribute and one metric to the Report View pane, as shown below.

-
In the Report View pane, click Switch to when the button displays the graph icon, which is shown in the image above. The graph report is displayed as a graph with random data to show how the graph report may appear once it is executed in Graph View.
-
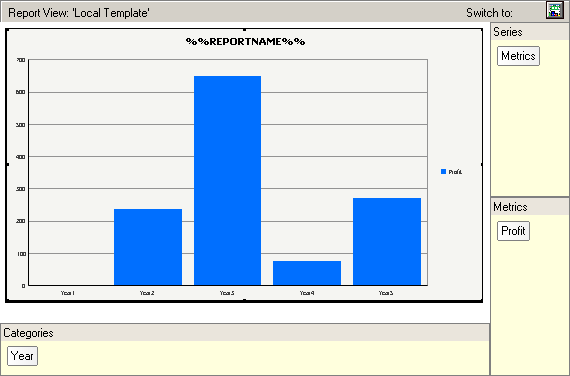
In the Graph toolbar, click the Show Drop Zones option (
 ). This displays areas to define the categories and series for your graph report, as shown below.
-
From the Object Browser, continue to add attributes, metrics, and other objects to the categories and series of the graph report.
-
Once finished, from the View menu, select Graph View to view your graph.
