MicroStrategy ONE
Steps to apply a gradient to a graph object
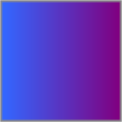
You can apply a gradient effect to several objects on a graph report, including the graph risers, markers, frame, and legend. This type of background style displays a blended effect to gradually change from one color to a second color. For example, the image shown below displays a gradient that changes from a dark blue color to a dark purple color.
Gradient effects cannot be used in conjunction with bevel effects.
To apply a gradient to a graph object
-
Open a report. (How?)
-
If the report is not already in Graph view, from the View menu, select GraphView to display the report as a graph.
-
Right-click a graph object such as a riser, marker, graph frame, legend, and so on, and select Formatname of object from the right-click menu. This option is named differently, depending on the object you select. For example, for a line in a line graph, this option is named Format Data Marker. The Preferences dialog box opens.
-
Click the Fill category. For information on the different options on this category and how you can modify the line of an object, see Fill formatting for graph objects.
-
From the Background type drop-down list, select Gradient to display gradient formatting options.
This gradient option is not available if you have applied a bevel effect to the graph object. You must define the bevel effect as None to be able to define a gradient. For steps to define a bevel effect, see Steps to apply a bevel effect to a graph object.
-
Define the gradient formatting, using the following options:
-
Colors: Define the two colors to use for the gradient. You select from the following color options:
-
One color: Allows you to select a color, and then define the gradient by determining how to blend the color from darker to lighter shades.
-
Two colors: Allows you to select two colors to define a blended effect to go from one color to the other color.
-
Shading Styles: Defines the type of direction for the gradient. For each shading style, you can select a Variant. For example, horizontal gradients display a blended gradient effect that goes from left-to-right or from right-to-left.
You can also use the Custom shading style to have more control over the angle and blending effects the gradient.
-
-
Click OK to apply the gradient to the currently selected object and return to the graph.