MicroStrategy ONE
Displaying off-scale values in a graph
MicroStrategy Developer allows you to specify a range of values for which to display items in a graph. However, some graph items may fall outside a given range. When this occurs, you can use the Off-scale Value Display drop-down list to change how they are displayed. There is a separate setting for each axis in a graph.
The display options are:
-
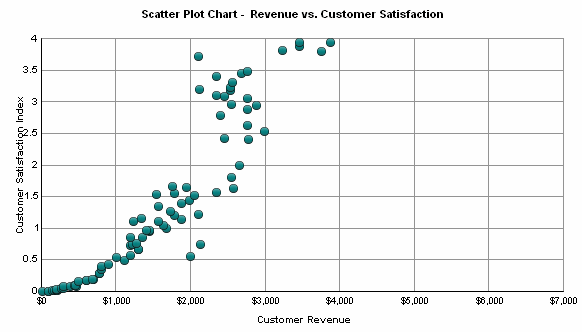
Hide Values: This option hides all elements which fall outside the specified minimum or maximum range for a graph. In the graph below, all data points representing a Customer Satisfaction Index of more than four have been removed from view.
-
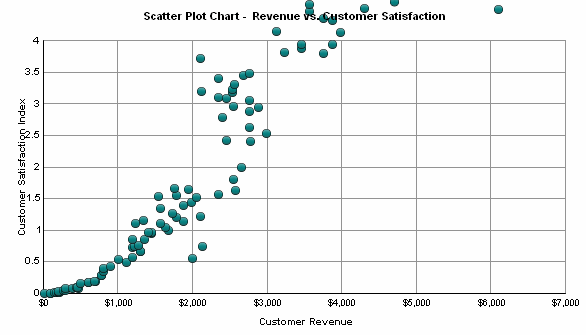
Show Values: This option displays all elements which fall outside of the specified range. These elements continue off the specified axes and are only constrained by the size of the graph area. In the graph below, data points with a Customer Satisfaction Index of more than four are shown continuing off the top of the graph.
-
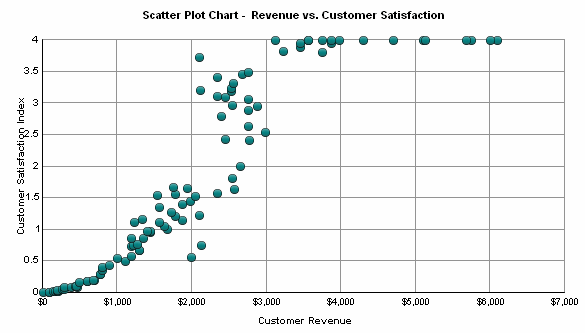
Clip Values: This option shows elements that fall outside the specified range, but forces them to fit into the graph by clipping them to the side. In the graph below, data points with a Customer Satisfaction Index of more than four can be seen clipped to the top of the graph.
The procedure below details how to specify an off-scale display option for a graph.
Prerequisites:
-
You are logged in to a project using MicroStrategy Developer.
-
A graph report has been created.
-
A range of values has been specified for at least one axis. For more information on defining ranges for graphs, see Axes, Grids and Scales category.
-
The graph includes graph elements which fall outside of the specified range. These steps can be completed without elements outside of the graph range, but the changes will not be visible.
To change the display of off-scale values
-
In MicroStrategy Developer, view a report in Graph View.
-
On the Graph menu, select Grids and Scales. The Preferences dialog box opens.
-
Expand the Axes category, and then expand the axis for which to modify the display of off-scale values.
-
Select the Grids and Scales category. The Grids and Scales options are displayed.
-
From the Off-scale Value Display drop-down list, select one of the following options:
-
Hide Values
-
Show Values
-
Clip Values
-
-
Click Apply to apply changes.
-
Click OK to exit the Preferences dialog box.
-
From the File menu, select Save to save the display change.