MicroStrategy ONE
Creating a view filter on a rank range of metric values
You can create a view filter that restricts report results based on a rank range of metric values for a given report. This can allow you to view analysis such as the bottom 20 products in terms of profit margin. Further analysis can be explored on this rank range of products to determine how to increase profit margins for these products, or decide which products should be discontinued.
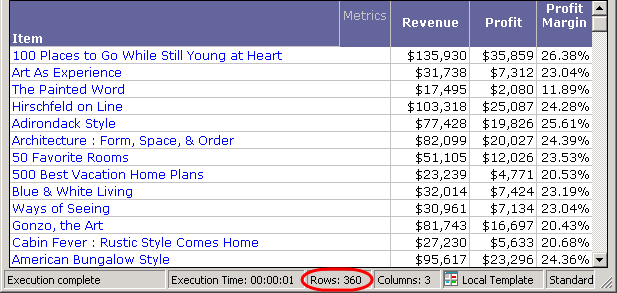
This type of report and analysis can be created in the MicroStrategy Tutorial project. You first create a report with Item, Revenue, Profit, and Profit Margin on the report, as shown below.

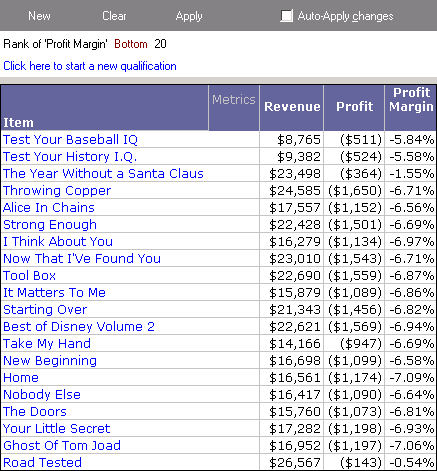
Only a subset of the report results are shown above, but notice that data for 360 items have been returned. To narrow the analysis of the report, you create a view filter to restrict the report results to the bottom 20 products in terms of profit margin. The view filter and resulting report are shown below.

With this updated report, you can now perform further analysis on each item to determine a strategy to improve your profit margins.
Notice that the view filter above uses the Bottom operator. For a description of each operator available when creating view filters with rank ranges, see Filtering metrics on rank and percentage ranges.
You can also create a new view filter qualification based on a rank range of metric values by right-clicking a metric, pointing to Filter On, and selecting Top N. For more information, see Filter on Metric dialog box.
The steps below show you how to create a view filter with a rank metric qualification, as well as how the example scenario above was created.
Prerequisites
-
You need the Use View Filter Editor (MicroStrategy Developer) and/or the Web Use View Filter Editor (MicroStrategy Web) privileges. These privileges are part of OLAP Services.
To create a view filter with a rank metric qualification
-
In MicroStrategy Developer, log in to a project.
For the example scenario, log in to the MicroStrategy Tutorial project.
-
Run a report in Grid View.
For the example scenario, create a report with Item, Revenue, Profit, and Profit Margin on the report, as shown in Creating view filters on a rank range of metric values.
-
If the View Filter area is not displayed, from the View menu, select View Filter.
-
In the View Filter area, click Click here to start a new qualification.
-
To create a rank metric qualification, click Field, point to Rank, and then select a metric.
For the example scenario, select Profit Margin.
-
Click Operator, and then select an operator.
For the example scenario, select Bottom.
-
Click Value, and then select Type a value. Type the value for the rank number you want to restrict data to.
For the example scenario, type 20.
-
If the Auto-Apply Changes check box is cleared, click Apply to apply the view filter to the report.
The report is updated. The report data is restricted as defined by the view filter. If you define multiple view filter qualifications at the same output level, you can modify the logical operator used to join the qualifications, as described in Joining view filter qualifications with operators. For information on the output level of view filter qualifications, see Evaluating qualifications at the report or grid level.
