MicroStrategy ONE
Creating a view filter on a percentage range of metric values
You can create a view filter that restricts report results based on a percent range of metric values for a given report. This can allow you to view analysis such as employees between 30% and 60% of tenure length with the company. You can then explore performance metrics within this percentage range of employees and determine where promotions and other actions are necessary.
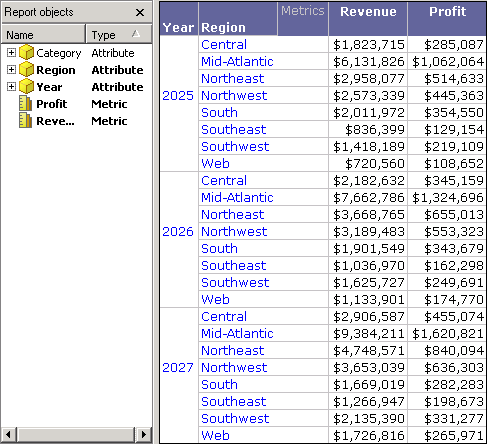
For example, you create a report with Year, Region, Category, Revenue, and Profit on the report, with Category not displayed on the report grid, as shown below.

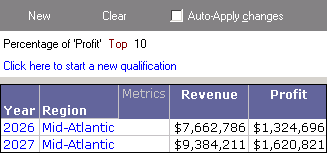
You decide to analyze this report to show only the data that is within the top 10% of profit. The view filter and resulting report are shown below.

With this analysis, you can now perform further analysis to determine why profit was at its highest during these years and within these regions.
Notice that the view filter above uses the Top operator. For a description of each operator available when creating view filters with percent ranges, see Filtering metrics on rank and percentage ranges.
You can also create a new view filter qualification based on a condition by right-clicking a metric, pointing to Filter On, and selecting Add Condition. For more information, see Filter on Metric dialog box.
The steps below show you how to create a view filter with a percent metric qualification, as well as how the example scenario above was created.
Prerequisites
-
You need the Use View Filter Editor (MicroStrategy Developer) and/or the Web Use View Filter Editor (MicroStrategy Web) privileges. These privileges are part of OLAP Services.
To create a view filter with a percent metric qualification
-
In MicroStrategy Developer, log in to a project.
For the example scenario, log in to the MicroStrategy Tutorial project.
-
Run the report in Grid View.
For the example scenario, create a report with Year, Region, Category, Revenue, and Profit on the report with Category not displayed on the report grid, as shown in Creating view filters on a percentage range of metric values.
-
If the View Filter area is not displayed, from the View menu, select View Filter.
-
In the View Filter area, click Click here to start a new qualification.
-
To create a percent metric qualification, click Field, point to Percent, and then select a metric.
For the example scenario, select Profit.
-
Click Operator, and then select an operator.
For the example scenario, select Top.
-
Click Value, and then select Type a value. Type the value for the rank number that you want to restrict data to.
For the example scenario, type 20.
Valid numbers for percent metric qualifications are 1 to 100.
-
If the Auto-Apply Changes check box is cleared, click Apply to apply the view filter to the report.
The report is updated. The report data is restricted as defined by the view filter. Further analysis on this report is performed to demonstrate how you can change the level of evaluation for view filter metric qualifications. This analysis is provided in Evaluating qualifications at the report or grid level.
If you define multiple view filter qualifications at the same output level, you can modify the logical operator used to join the qualifications, as described in Joining view filter qualifications with operators. For information on the output level of view filter qualifications, see Evaluating qualifications at the report or grid level.
