Strategy ONE
MicroStrategy Mobile overview
MicroStrategy Mobile is an application for mobile devices that allows analysts to view, refresh, and analyze MicroStrategy reports and Report Services documents. With MicroStrategy Mobile, you and other business users receive the same reports and documents on your mobile device as you do in MicroStrategy Web, MicroStrategy Office, or MicroStrategy Developer. You can then analyze the reports and documents on your mobile device by sorting data, repositioning objects, grouping data by page, and more.
MicroStrategy Mobile works on the following mobile devices:
-
Android® device
-
Apple iPad®
-
Apple iPhone®
Reports and documents displayed on mobile devices can use the following features:
-
Widgets, which are Flash-based displays of the results of dataset reports, allowing users to visualize data in different ways than traditional reports displayed as Grid/Graphs do. Widgets are sophisticated visualization techniques that can combine with rich interactivity to enable users to understand their data more effectively. A widget can be displayed in a document on mobile devices, and a report can be displayed as a widget on mobile devices. For examples of widgets used on mobile devices, see Widgets for mobile devices.
-
Links that interact with applications installed with the mobile device, such as email or text messaging. For example, a document can send addresses to Google Maps for directions or can link to a video.
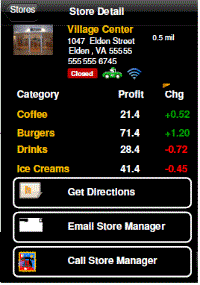
For example, you create a document for the regional managers for a chain of stores. This document contains information about each of the stores in the manager's region. The information includes the store's address, phone number, the store manager's email address, its inventory figures, and so on. When the regional manager views this document on his mobile device, he can click a link to:
-
View a map of the store's location and get directions from his present location
-
Email the store manager
-
Call the store

-
Links to reports and other documents. A link lets the user execute another document or report (the target) from a document (the source), and to pass parameters to answer any prompts that are in the target.
For example, if a user is viewing a document containing regional sales, she can select a particular region to execute another document that displays sales for the stores in that region. This is a form of drilling, where the user has drilled from region to store. The source document could also link to the underlying dataset report, to display profit and cost values as well.
-
-
Prompts specifically designed for use on mobile devices. For examples of some of these prompt types, see Prompts for mobile devices.
-
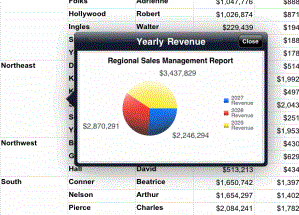
Information Windows let users view additional information about an attribute element by tapping the element in a grid or graph. The Information Window pops up over the element, displaying an additional visualization, based on the element. An example of an Information Window is shown below:

-
In this example, the Region column in the grid is used as a selector. When a user taps an element in the column, the Information Window appears.
-
Information Windows can contain images, such as corporate logos or buttons; data fields to display information about attributes and metrics in the documents, or other details; links to mobile device applications, such as a link to call the phone number of a selected store location; or links to other reports or documents.
-
-
Formatting documents specifically for mobile devices, to ensure that the documents display correctly on the devices. You can use:
-
Display properties such as optimizing the layout for display on a mobile device, and whether or not the Filter icon is displayed.
-
Templates, which help you design a document sized correctly for display on a mobile device.
For examples of documents and reports displayed on mobile devices, including instructions on how to navigate them and other basic tasks, see the Strategy Mobile Analysis Help . For complete information on creating documents and reports for MicroStrategy Mobile, including best practices and procedures to create the features described above, see the Strategy Mobile Administration Help.
You can create an alert-based subscription for a mobile device, to allow you or other users to automatically receive notifications on a mobile device with MicroStrategy Mobile when a metric on a report meets specific alert conditions. For more information and steps to create an alert-based subscription, see the Strategy Mobile Administration Help.
You can also display Visual Insight (VI) dashboards on an iPad with MicroStrategy Mobile. A VI dashboard is a customized, interactive display that you can use to explore your business data. You can sort and rearrange data in an interactive grid, perform manipulations on the data to display only the information you are interested in, and display visual representations of the data in the VI dashboard to make the data easier to interpret. VI dashboards can be viewed in the Dashboard Editor, Flash Mode, or Express Mode in Web, as well as on an iPad. For a general overview of VI dashboards, see About Visual Insight (VI) dashboards. You create VI dashboards in MicroStrategy Web; for instructions, see the MicroStrategy Web Help.
