Strategy One
Main Dashboard Screen
Use the Main Dashboard screen to access all of the features and functionality for creating dashboards.
Starting in Strategy One (September 2025), a new Dashboard Editor is available. To enable it, see Enable the New Dashboard Editor.
-
To view and hide panels, click the corresponding icon in the left toolbar.
-
Prior to Strategy One (November 2025), select the panel from the View menu. To display the Filter or Format panel, select Editor from the View menu. All three panels display, stacked together.
-
-
Starting in Strategy One (November 2025), the Contents and Datasets panels display stacked together.
-
The Editor, Filter, and Format panels display stacked together.
-
Change the display order by dragging the titles.
-
Unstack the panels by dragging a panel to a different area of the screen.
-
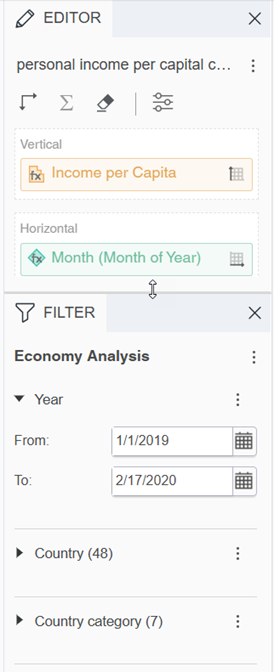
Starting in Strategy One (November 2025), you can place the Editor, Filter, and Format panels above and below each other as though in a column. The example below shows the Editor panel displayed above the Filter panel. To do this, drag the Filter panel to the bottom of the Editor panel. You can then adjust the relative height of the panels by hovering your cursor over the line dividing the panels and dragging the resizing icon up or down.
-
-
Starting in Strategy One (April 2026), you can freely stack your panels vertically and horizontally. Click and drag a panel underneath or in between existing panels to customize your editing interface.
-
The Layers and Themes panels display stacked together.
-
To show and hide all the currently displayed panels at once, click Hide/Display All Panels
 in the toolbar.
Access
To access the main Dashboard screen, edit an existing dashboard or create a new one. To edit an existing dashboard:
-
In Workstation, double-click the dashboard.
Fields
Visualization Area: Displays the data that has been added to the dashboard, including interactive visualizations, text fields, and other objects. Also referred to as the Layout Area. See Introduction to Visualizations for more information.
Toolbar: Provides the most commonly used tools, including Undo  and Redo
  .
.
Contents Panel: View the structure of chapters and pages within your dashboard, as well as navigate between them.
-
Click a page to open it.
-
Click a chapter to open the first page of that chapter.
Datasets Panel: Lists the dashboard's datasets, and the attributes and metrics in each dataset. You can drag and drop objects from the Datasets panel to add them to a visualization, filter a visualization based on an attribute or metric, display them in a text field, and so on.
Editor Panel: Displays the objects that have been added to the currently-selected visualization. Drag and drop objects from the Datasets panel to the Editor panel to add them to the current visualization.
Filter Panel: Displays the filtering options for the current chapter. To filter the chapter to refine the data displayed in all of its pages, select and change the filtering options. See Filter Data for information about creating filters.
Format Panel: Displays the formatting options for the selected object (for example, visualizations, text, images, etc.). You can select formatting options to specify the type of graph elements to display in a graph visualization, banding options for a grid visualization, whether to allow rectangles to be deleted in a heat map visualization, format the title of a filter, size an image, and so on.
Layers Panel: Lists the content that has been added to the visualization area. You can rename layers, rearrange layers, multi-select layers to group and ungroup them, or select layers to modify them on the Editor, Filter, and Format panels.
Themes Panel: Indicates the theme applied to the dashboard. Lists the available themes in thumbnail previews. Change the dashboard's theme by clicking a thumbnail.
-
Use a theme to easily and efficiently change the look and feel of the dashboard. The theme includes default font type, size, color palette on visualizations, and fill color among other formatting properties in different visualizations and component types. For more details, see Define Reusable Dashboard Themes.