Strategy One
Editor Panel
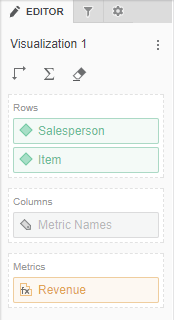
The Editor panel contains a list of all the attributes and metrics that display as data in the selected object. To view the dataset objects for a specific object, click it in the Layout area.
The Editor panel displays for:
Access
- Open an existing dashboard or create a new one.
- Select the visualization or attribute/metric selector in the dashboard.
- The Editor, Filter, and Format panels are stacked together by default. Click Editor
 to open it.
 - If the Editor panel is not available, do one of the following:
Starting in Strategy One (November 2025), click the Editor Panel icon
in the left toolbar. Prior to Strategy One (November 2025), from the View menu, select Editor Panel.
-
You can change the location of the panel by dragging it to a different area of the screen. For example, you can drag only the Filter panel to the left, leaving the Editor and Format panels stacked.
-
Starting in Strategy One (November 2025), you can place the Editor, Filter, and Format panels above and below each other as though in a column. To do this, drag one panel to the bottom of another. You can then adjust the relative height of the panels by hovering your cursor over the line dividing the panels and dragging the resizing icon up or down.
- To add data to the object, drag attributes or metrics from the Datasets panel to the Editor panel. For visualizations, a blue indicator line displays in the area to which you add the attribute or metric.
Fields for Each Visualization Type
The fields on the Editor panel differ, based on the type of visualization you create. See the following topics for information related to building each visualization type on the Editor panel:
- Editor Panel for a Grid
- Editor Panel for a Graph Visualization
- Editor Panel for a Heat Map
- Editor Panel for a Map Visualization
- Editor Panel for a Geospatial Service Visualization
- Editor Panel for a Network Visualization
- Editor Panel for a KPI Visualization
Tasks
Use the Editor panel to perform the following tasks:
- Rename a Visualization
- Add, Replace, or Remove Data from a Visualization
- Add Subtotals to a Grid
- Move Rows or Columns in a Grid
- Sort Data in a Grid Using Multiple Objects
- Sort Data in a Graph or Heat Map Based On a Single Object
- Swap Objects in a Grid, Graph, Waterfall Chart, or Box Plot
- How to Add and Rearrange Data in a Graph Visualization
- Remove a Sort from a Graph or Heat Map
- How to Abbreviate the X and Y Axes Values in a Graph Visualization
- View Information About Visualization Elements
- Add Multiple Conditions to a Threshold in the Advanced Thresholds Editor
- Rename an Object
- Format Numeric Values in a Visualization
- Select Which Attribute Forms to Display in a Visualization
- Create a Derived Attribute
- Create a Derived Metric Using the Metric Function Editor
- Create a Threshold on a Metric Using the Quick Thresholds Editor
- Create Multiple Element Groups