Strategy One
Create a Modern Grid with Microcharts
A modern grid visualization allows you to include microcharts within cells. Microcharts are small versions of visualizations shown without labels, that convey information so that a user can, at a glance, determine the trend of a metric over time or how a metric is performing compared to forecasted figures. The modern grid is useful for this purpose because individual microcharts display attribute and metric data in a small graph that would otherwise be displayed as a single value in the grid cell. You can determine the trend of a metric trend with just a quick glance at a microchart. A modern grid supports sparkline, bullet, and trend bar microcharts, as well as basic grid functionality and the column sets of compound grids.
For example, the modern grid shown below contains two microcharts:
-
A sparkline representing the number of flights for each day of the week
-
Trend bars representing the number of flights delayed for each departure airport
These microcharts display for each of the airline rows.

The modern grid shown below displays the number of flights and a bullet microchart for each airline name, that is, each row.
-
The number of flights displays in a column set. Column sets in a modern grid or a compound grid can contain multiple unrelated attributes and metrics in different sets of columns that are then stitched together in one grid. Each column set can appear differently as thresholds, advanced filters, and formatting can be applied to each set.
-
The bullet microchart provides a quick view of performance against a target. It displays as a horizontal bar that represents the actual value, a target marker that indicates the goal, and at least one band. Use the bands to show performance thresholds such as good, average, and poor; interim targets, or a way to evaluate the actual metric's progress toward the target. The example below tracks the performance of delayed flights against a goal, with bands marking 1/3 and 2/3 towards the goal.

Create a Modern Grid
-
In the top toolbar, click

- Choose Grid then Grid (Modern)
 .
. -
In the Datasets panel, double-click attributes and metrics to add them to the visualization. Attributes display in the rows while metrics display in the columns. You can display metric columns as well as microcharts and compound grid column sets.
-
To add a sparkline microchart:
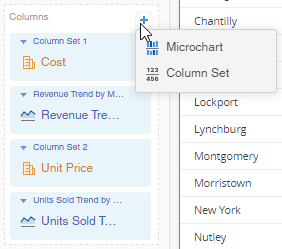
- In the Editor panel, click Add Microcharts/Column Set
 and select Microchart.
- In the Microcharts window, from the Type drop-down list, select Sparkline.
- From the Metric drop-down list, select the metric to plot.
- From the Attribute drop-down list, select the attribute to graph. The sparkline displays a point for the metric value of each attribute element (such as the number of flights for each day), connected by a line.
-
The Name box auto-populates with Metric Name Trend by Attribute based on the metric and attribute you selected for the microchart. Type a new Name if necessary. The Name displays as the column header in the grid.

- In the Editor panel, click Add Microcharts/Column Set
-
To add a trend bar microchart:
- In the Editor panel, click Add Microcharts/Column Set and select Microchart.
- In the Microcharts window, from the Type drop-down list, select Trend Bars.
- From the Metric drop-down list, select the metric to plot.
- From the Attribute drop-down list, select the attribute to graph. The bar chart displays a bar for each attribute element; the bar represents the metric value of the attribute element (such as the number of delayed flights for each airport).
-
The Name box auto-populates with Metric Name Comparison by Attribute based on the metric and attribute you selected for the microchart. Type a new Name if necessary. The Name displays as the column header in the grid.

- In the Editor panel, click Add Microcharts/Column Set
-
To add a bullet microchart:
- In the Editor panel, click Add Microcharts/Column Set and select Microchart.
- In the Microcharts window, from the Type drop-down list, select Bullet.
- From the Actual drop-down list, select the metric that calculates the actual values.
- From the Target drop-down list, select the metric that calculates the target values.
-
The microchart displays one to three bands, which are interim targets or a way to check the actual metric's progress toward the target.
-
If you have only one band, select the metric from the Band 1 drop-down list.
-
If you are using multiple bands, select the metric that calculates the highest values from the Band 1 drop-down list. The Band 2 metric should be the middle band, and Band 3 is the lowest values.
The bullet microchart definition below creates the microchart shown here. The actual metric is Flights Delayed and the target is Delayed Flights Target, which is calculated as 75% of total flights. Two bands display in the microchart: Band 1 is 50% of total flights and Band 2 is 25% of total flights.

-
-
The Name box auto-populates with Metric NamePerformance based on the Actual metric you selected. Type a new Name if necessary. The Name displays as the column header in the grid.
- In the Editor panel, click Add Microcharts/Column Set
-
A modern grid can contain multiple microcharts and column sets.
- To create a column set, in the Editor panel, click Add Microcharts/Column Set and select Column Set. Drag and drop attributes and metrics to the new column set drop zone.
- To create a column set, in the Editor panel, click Add Microcharts/Column Set
-
To change the order that microcharts and column sets display on the grid, in the Editor panel, drag and drop a microchart or column set into a new position.
-
You can total the rows and columns of the modern grid.
-
Select the Level for Subtotal Calculation in Modern Grids (beginning in Strategy One (December 2025))
-
Define Custom Subtotals in Modern Grids(beginning in Strategy One (December 2025))
-
You can format each microchart individually or all the microcharts at once. Formatting options for all microcharts include chart height, vertical alignment, and font, among others. Each type of microchart also has individual formatting options. For example, you can display or hide the data point spots for a sparkline; for a trend bar, you can choose different bar colors for positive and negative values. Starting in Strategy One (March 2025), you can format a modern grid at a more granular level. You can individually format each attribute and each metric column, as well as format all attributes, all metrics, or all microcharts at once. For more information on microchart formatting, see Format Panel for Grid Visualizations. For general information on formatting grids, including modern grids, see Format a Grid.
Note: If you add a column to a grid to adjust aggregation, joins, thresholds, or sorting, you may not want end users to view the actual values or elements. In a modern grid, you can hide a column from display. The metric or attribute still displays in the Editor panel, but not on the grid when editing or viewing the dashboard. To hide the column, right-click the column header and select Hide Column. To redisplay it, click the menu icon for the grid and select Show Hidden Columns.
-
An end user viewing the dashboard does not know that any columns are hidden. However, an end user can hide and show columns as well, but it applies only to that user's view of the dashboard. For steps, see Hide Columns in a Modern Grid.