Strategy One
Create Transactions in Grids
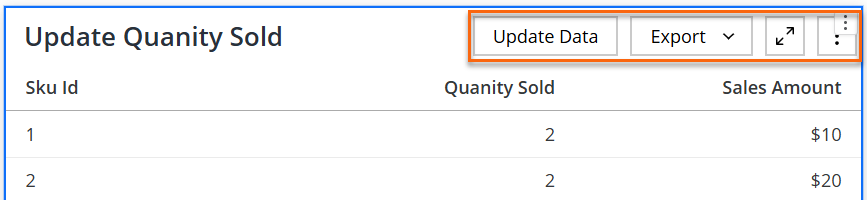
Starting in Strategy One (September 2025), dashboard authors can customize the title bar for transactional grids, enabling personalization of action buttons and secondary titles.
Starting in MicroStrategy 2021 Update 6, you can create transaction grids for dashboards. This allows you to add, edit, or remove data from relational databases using the provided column mapper or your own defined SQL statements. Transaction grids for dashboards should be configured on live datasets.
To configure transaction grids in dashboards, you must at least have the Web configure Transaction privilege.
To interact with or use transaction grids in dashboards, you must at least have the Execute Transaction privilege.
Check out the video below to learn more!
Configure a Transaction Grid
-
Open a dashboard.
-
In the top toolbar, click

-
Choose Grid > Grid (Modern)
 .
. -
In the Editor panel, add your rows and columns.
-
Click More
 in the upper right corner of the visualization and choose Configure Transaction. Starting in MicroStrategy ONE Update 11, under Format Panel > Transaction Configuration tab > Configure Transaction, you can click Use SQL to start the configuration.
 -
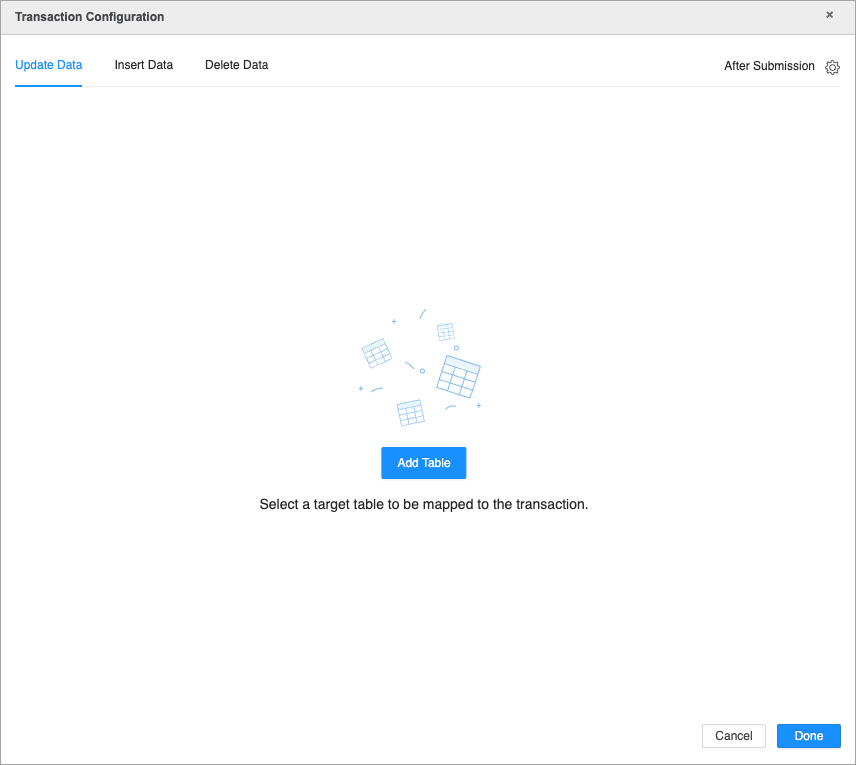
Choose to update, insert, or delete data and click Add Table.
If you are creating a SQL form transaction, you can only use one transaction type (update, insert or delete).
-
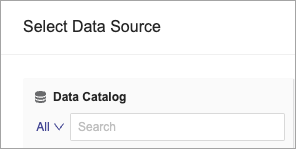
Select a data source.
The user selected to configure the data source must have permissions to update, insert, and delete data.
-
Use the Object Browser panel to search for the desired attributes and metrics, and drag them into the Editor panel.
-
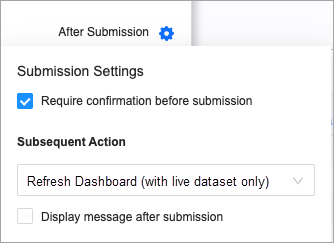
To personalize the submissions settings, do one of the following:
-
Click Settings
 in the upper right corner of the transaction configuration dialog to personalize the submission settings.
 -
Starting in MicroStrategy ONE Update 11, in the Format panel > Transaction Option tab, you can click More
next to Transaction. Click After Submission and personalize your submission settings.
-
-
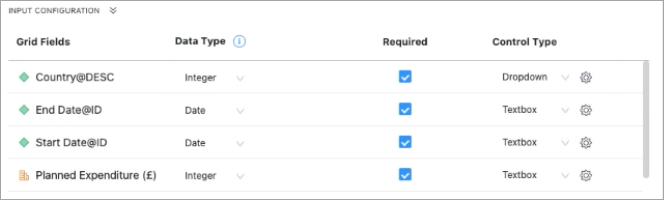
Click Input Configuration to set rules and select the control type for your columns.
-
Column selection and requiredness
-
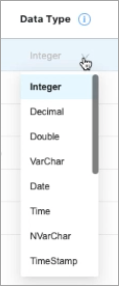
Data type selection
-
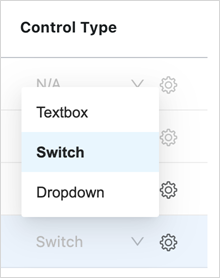
Control type selection and configuration
Starting in Strategy One (July 2025), the slider input control is available when the corresponding column has a metric or number value.
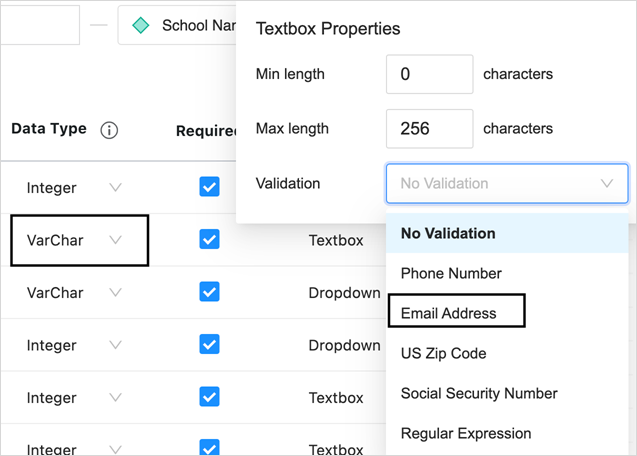
Textbox controls:
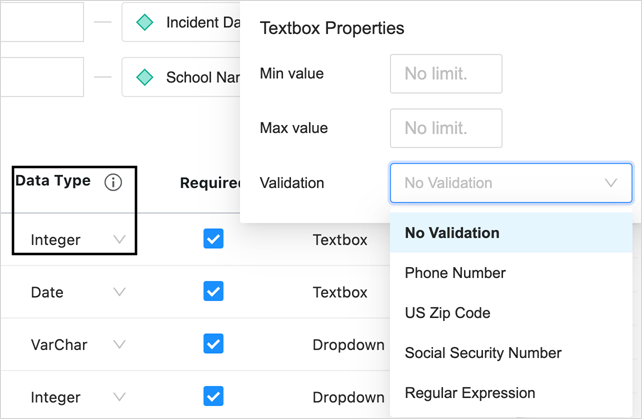
For the Textbox control type, depending on the data type, number and string based configurations are provided with corresponding validations. Starting in MicroStrategy ONE Update 11, the text box input control supports line breaks when the data type is VarChar or NVarChar and no validation is defined for the text box.
For most update and insert data cases, you can click Enter to start a new line. In bulk editing mode in Library and Workstation, you can click Alt + Enter for Windows or click Option + Enter for Mac (Library only) to start a new line.
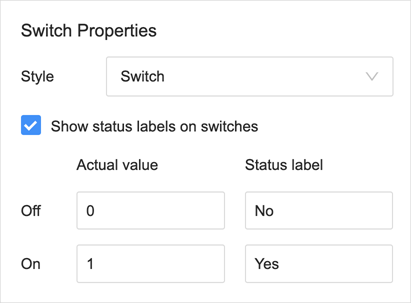
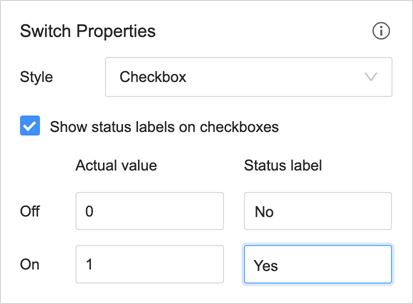
For the switch control type, both switch and checkbox styles are supported.
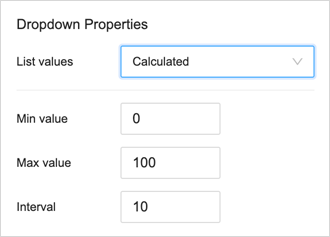
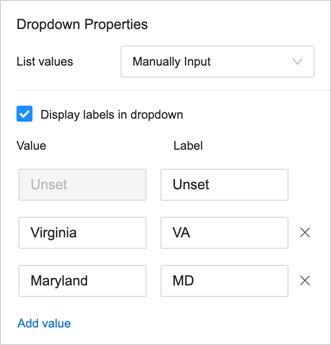
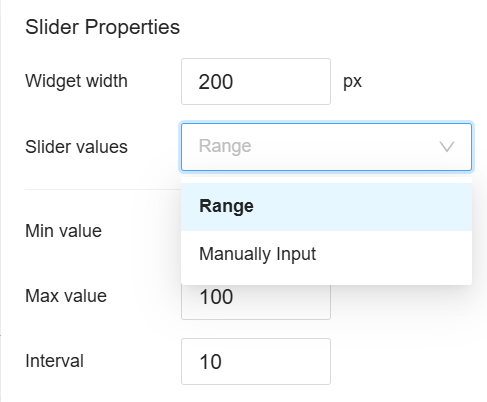
For the Dropdown list control type, calculated list, manual input list, and a data driven input control list is supported. For the Calculated list, you can set the value range and interval size.
For manual lists, you can define labels to display the data.
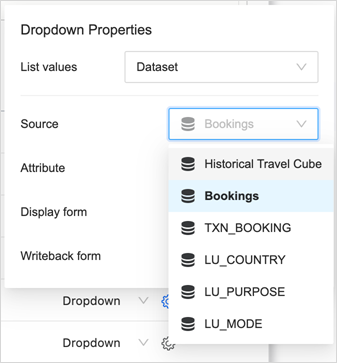
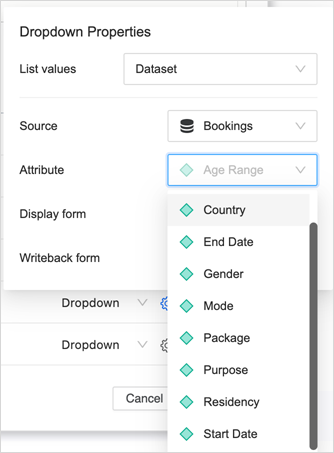
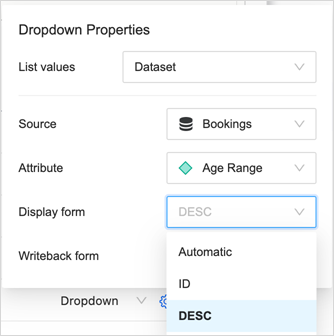
From the DDIC (data driven input control) dropdown list, you can choose any dataset in the dashboard, an attribute from that dataset, and pick display attribute forms and the attribute form to write back.
For the Slider control type, both range and manual input are supported.
-
-
Click Done to complete your transaction and Save your dashboard.
-
You can pause transaction manipulations to apply configuration changes. Perform one of the following:
-
Click More
in the upper right corner of the visualization and choose Edit Transaction. In the transaction configuration dialog, toggle the action that you want to pause. -
Select the grid. In the Format panel under the Transaction tab, toggle the action that you want to pause.
-
Click More
in the upper right corner of the grid. Choose Pause Actions then select the check box of the action that you want to pause.
-
Filter elements displayed in Transaction dropdown lists
Dynamically filter a Transaction element dropdown list using an Element Filter or a visualization. This feature enables users to limit the elements shown in the Transaction Services dropdown control based on a filter applied to the modern grid visualization. This streamlines the data entry experience for end users and reduces error rates when submitting transactions.
Filter using an Element Filter
-
In the top toolbar, click Filter and choose Element/Value Filter. An empty selector is added to the dashboard.
-
Drag the attribute to use as a filter from the Datasets panel.
-
Click Select Targets.
-
Click the Transaction Grid.
-
Select the column in the grid that you want to allow the selector to filter and click OK.
-
Click Apply.
![]()
Filter using a visualization
-
Add a source visualization to the dashboard.
-
Click More
in the upper right corner of the visualization and chooseSelect Target Visualizations. -
Click the Transaction Grid.
-
Select the column in the grid that you want to allow the selector to filter and click OK.
-
Click Apply.
Display two lines on the title bar
Starting in Strategy One (September 2025), dashboard authors can customize a visualization's title bar to display a secondary title.
To display two lines in the title bar:
-
Right-click the visualization and select Format.
-
On the Format panel, select the Title and Container icon
 .
. -
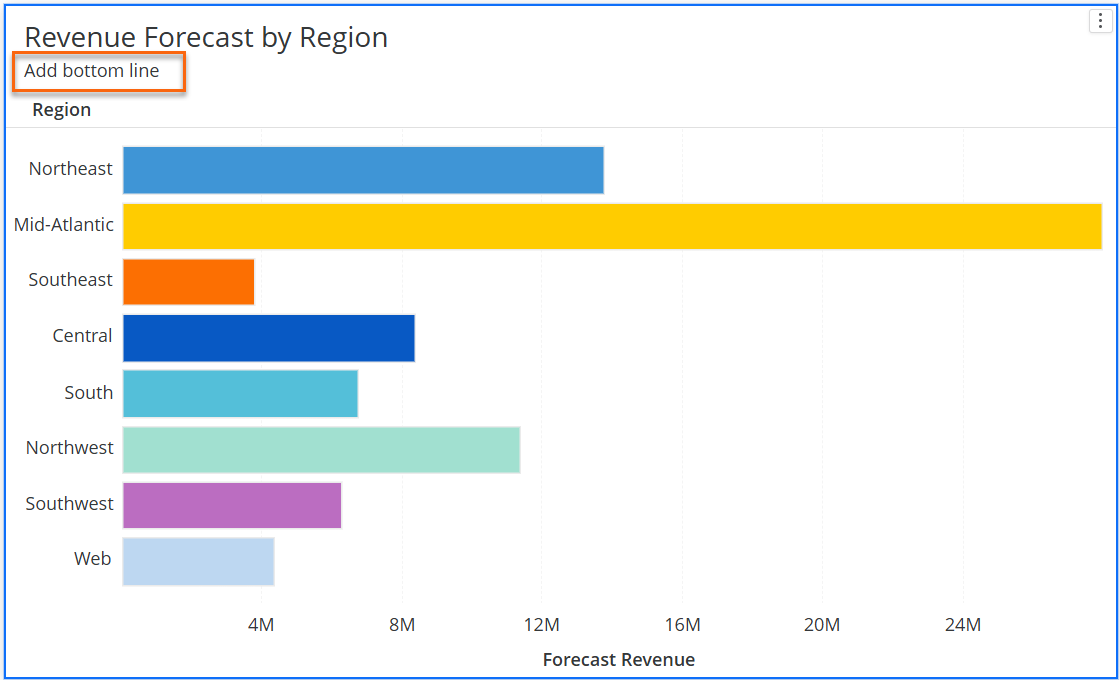
Under Titles, select 2 Lines.
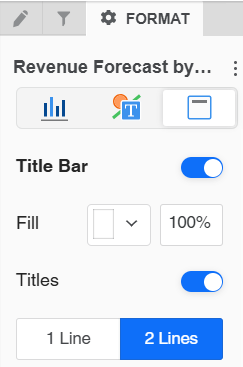
A secondary title is added to the visualization's title bar.
-
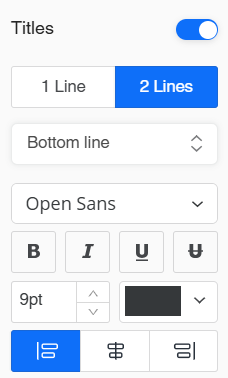
To format the secondary title, select Bottom line from the drop down list.
- Select the desired font, style, size, color,and alignment for the text.
Personalize action buttons on the title bar
Starting in Strategy One (September 2025), dashboard authors can customize a visualization's title bar by enabling action buttons.
To enable or disable the action buttons on the title bar:
-
Right-click the visualization and select Format.
-
On the Format panel, select the Title and Container icon
. -
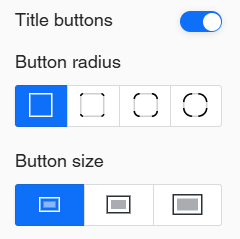
Next to Title buttons, use the switch to enable or disable the buttons.
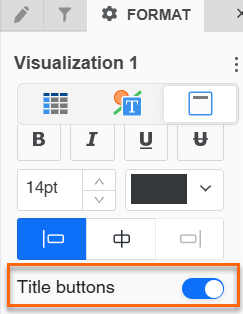
Action buttons are added to the visualization's title bar.
-
To format the layout of the title buttons, you can:
- Adjust the Button radius
- Select the Button size
-
For each individual button, use the icons next to the button to:
- Hidethe button
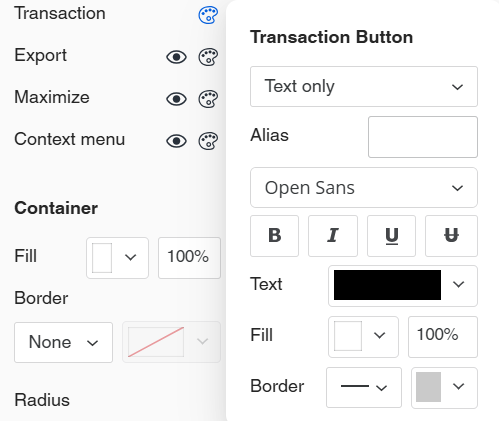
- Format the button
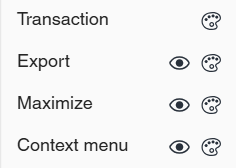
The formatting options vary based on the button. The example below is for the Transaction Button.
Related Topics
KB485696: Add automatic fields to transactional grids in dashboards