Strategy One
Introduction to Grids
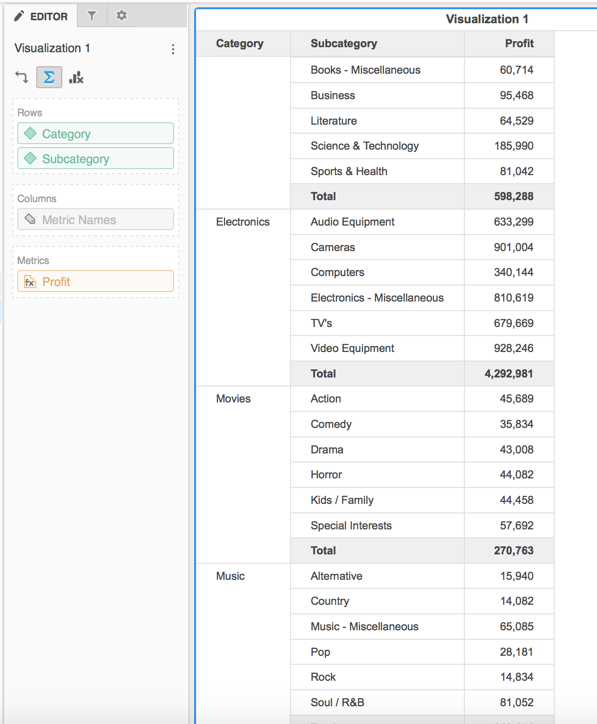
You can display data in a grid layout.
After creating a grid, interact with its data to customize your view, by performing the following tasks:
- Add and display dynamic links in the grid.
- Add subtotals to the grid.
- Format the grid
- Filter data in a second visualization by selecting attribute elements or metric values in the grid.
- Analyze data in the grid by sorting data, rearranging data, displaying subtotals, etc.
Use grid visualizations as an intermediate tool to help understand your data and prepare it for display in other types of visualizations, by performing the following tasks:
- Select a subset of your business data to display by filtering and drilling on data. Then, change the grid visualization into the type of visualization that you want to use to display your data.
- View the values of attributes and metrics in a dataset. If you have a dataset that contains unfamiliar data, you familiarize yourself with it by displaying it in a grid visualization.
- Identify and resolve problems with your datasets. When you link attributes that are shared in common across datasets, you can confirm whether the data linking creates the expected results by displaying data from the linked datasets in a grid visualization. See Introduction to Using Multiple Datasets in a Visualization for more information. Once you are satisfied with the results, you can change the grid visualization into the type of visualization you want to use to display your data.