Strategy One
Introduction to Network Visualizations
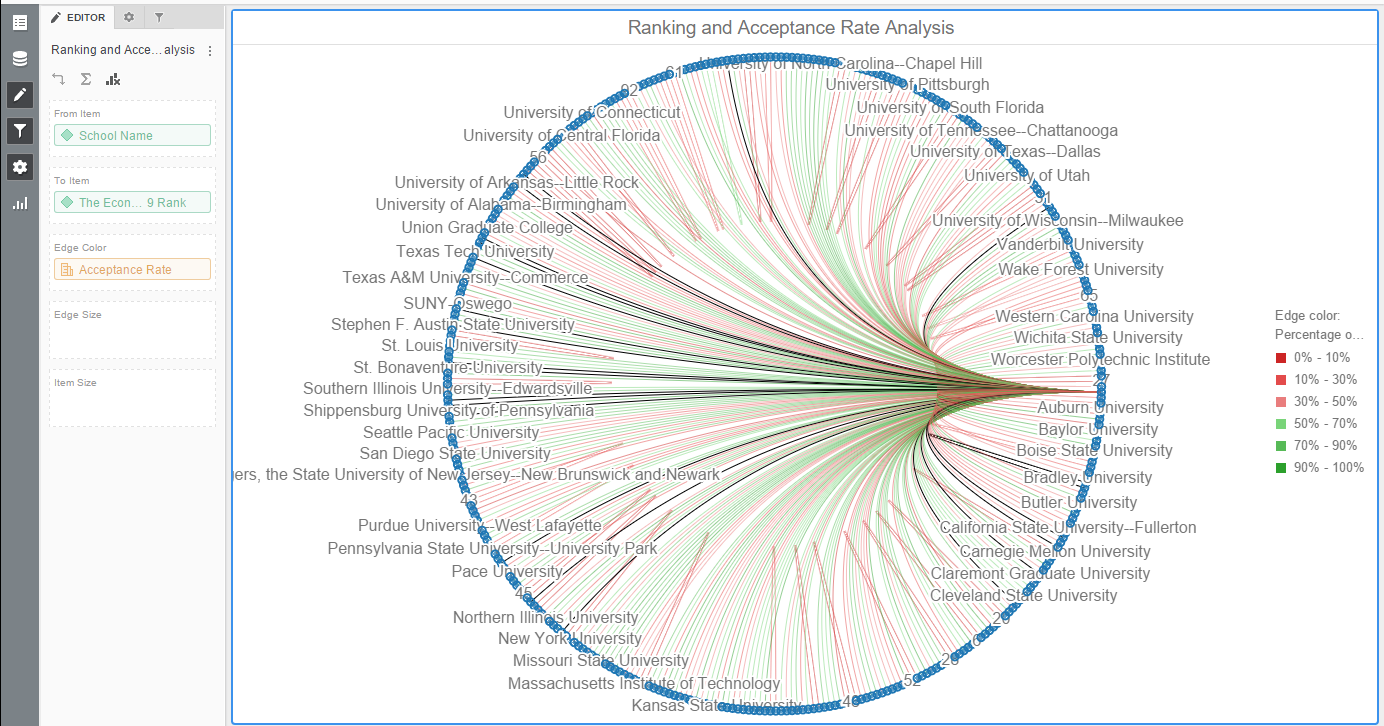
You can quickly and easily identify relationships between related items and clusters by displaying your data with a network visualization. A network visualization is useful when visualizing a social network or performing a market basket analysis. Attribute elements appear as nodes in the visualization, with lines (called edges) drawn between the nodes to represent relationships between elements. Once the visualization is created, you can view characteristics of the nodes and the relationships between them, using display options such as node size, edge thickness, and edge color. If a node appears for each store in a country, you can display a connection between two nodes using a thicker line if the two stores share a large number of customers.
Related Topics
Create a Network Visualization