Strategy One
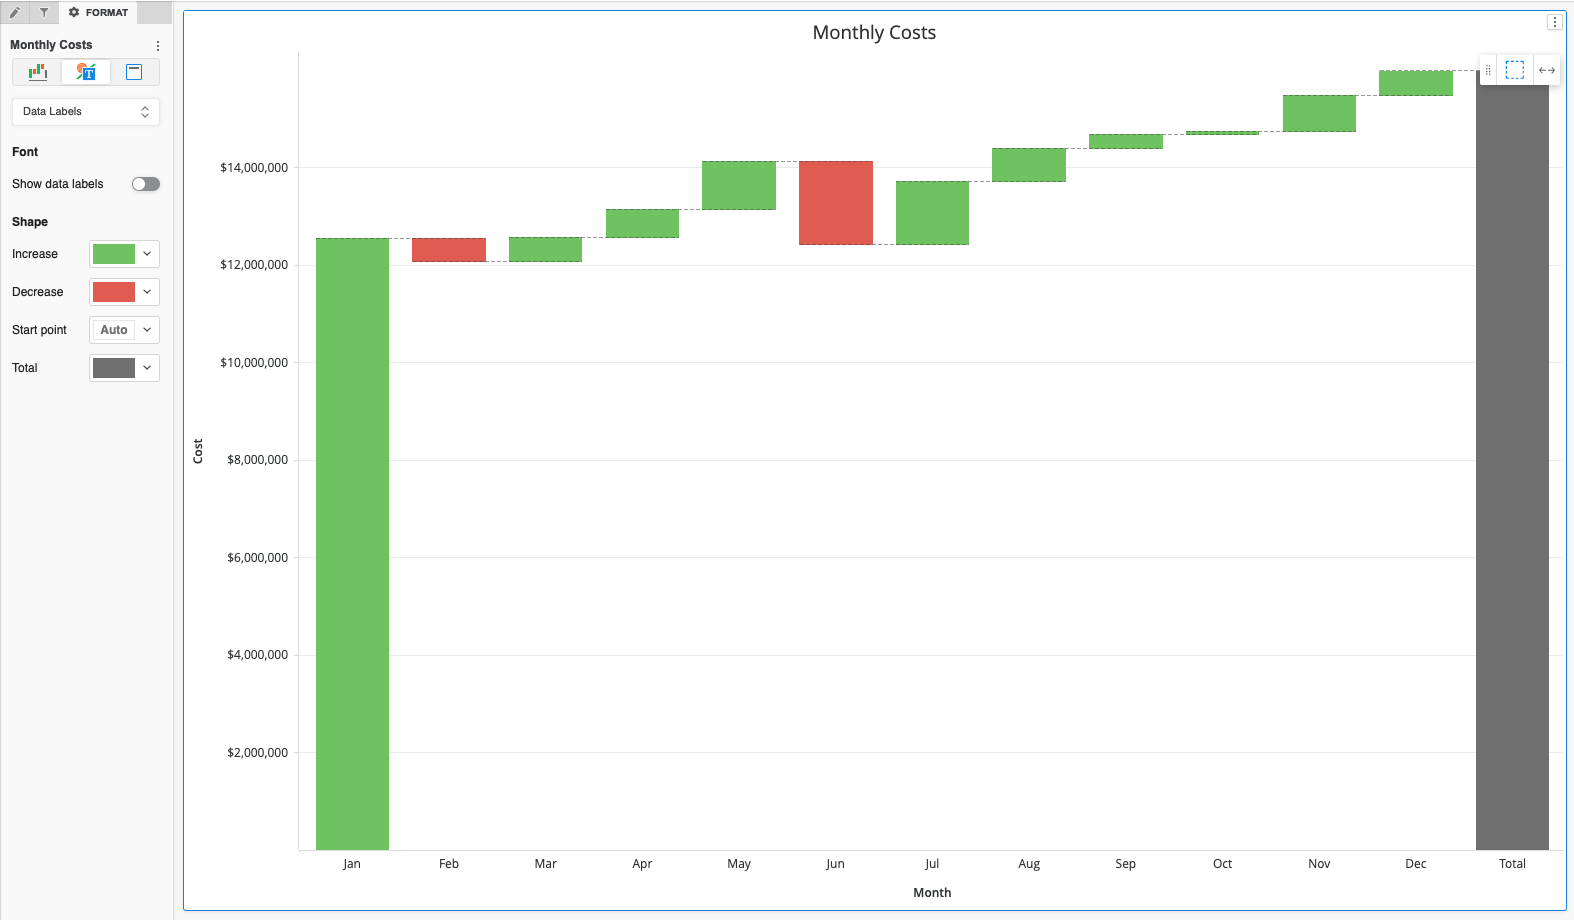
Create a Waterfall Chart
Use the Waterfall Chart to visualize the cumulative effect of sequentially introduced positive and negative values. Columns and colors can show how an initial value is affected by a series of intermediate positive and negative values. Click here to see an example.
- In the Waterfall Options section of the Format panel, change the calculation mode to Show Difference.
- Switch to another visualization type and then choose the Waterfall Chart type again.
- If you choose to switch back to the Show Sum calculation mode, you will still retain the latest version
- Open a dashboard.
-
In the top toolbar, click

-
Choose More > Waterfall
 .
. - In the Datasets panel, double-click attributes and metrics to add them to the visualization. A waterfall chart requires at least one attribute and one metric.
- In the Format panel, select Waterfall Options from the first drop-down to modify formatting options, specific to waterfall charts.
-
Choose to color the starting point statically or dynamically (by increase or decrease). In the Text and Form tab of the Format Panel, under Start point, choose Auto. You can always reset back to a static color with the Reset
 button.
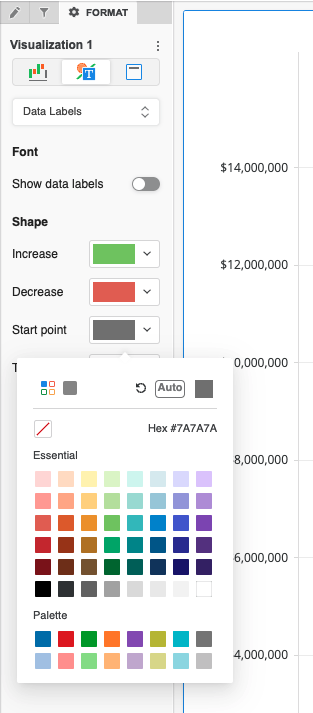
Example Waterfall Chart