Strategy One
Introduction to Metrics
Metrics represent business measures and key performance indicators. From a practical perspective, metrics are the calculations performed on data stored in your database, the results of which are displayed on a report. Metrics are similar to formulas in spreadsheet software. For example, in a report that shows sales in the Southeast, sales is the metric.
Metric calculations can show information at simple levels as well as at complex levels of analysis: displaying sales trends, growth patterns, percent-to-total contributions, and profit analysis. Questions such as "What were the sales for the Eastern Region during the fourth quarter?" and "How many employees received a bonus greater than $5000 in the last three years?" can easily be answered by creating metrics.
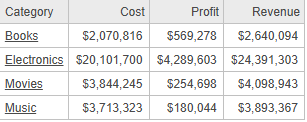
Specifically, metrics define the analytical calculations to be performed against data that is stored in the data source. A metric is made up of data source facts and the mathematical operations to be performed on those facts, so that meaningful business analysis can be performed on the results. A metric on a report, document, or dashboard shows a list of values used for analytical calculations. For example, the report shown below contains the Cost, Profit, and Revenue metrics, with values displayed for each Category.
For steps to create a metric, see Create a Stand-Alone Metric. The Metric Editor in Workstation can guide you through the process of selecting functions and expressions, or you can type the metric formula directly. You can create metrics that combine multiple metrics or contain custom expressions.
You can use metrics on dashboards and documents as well as reports. You also use metrics when creating filters and prompts.
For an introduction to metrics and some basic examples, see the Creating a Query chapter in the Basic Reporting Help. For advanced concept information about metrics in general, with a focus on level, conditional, and transformation metrics, including examples, see the Advanced Reporting Help. For a description of the functions available for metrics, see the Functions Reference.
Stand-Alone vs. Derived Metrics
You can create:
-
Stand-alone metrics, which can be placed on multiple reports and dashboards; those reports can be used as datasets on multiple dashboards and documents. Stand-alone metrics can also be used to create filters and prompts. Reusing metrics ensures consistency with the definition and format, as well as saving time.
-
Derived metrics within reports, dashboards, and documents. These are created using only the objects available in the report, dashboard, or document. They are saved within that report, document, or dashboard, and therefore cannot be used outside of it. See:
-
Metrics in Dashboards for an introduction to derived metrics created in dashboards
-
Creating Multiple Metrics that Perform the Same Calculation: Base Formulas
If you are creating multiple metrics and each metric uses the same basic calculation as part of its formula, you can save time by creating a base formula to perform the calculation. You can then define additional metrics based on the base formula instead of typing the same calculation multiple times. Base formulas are time-savers because of their reusability and ease of maintenance. When you update a base formula, the changes are automatically reflected in all metrics that use it, ensuring consistency.
For example, you want to create a Profit metric and a Profit Margin
metric. You create a Revenue metric which calculates Price
x Quantity. You can then define the Profit metric as Revenue
- Cost, and the Profit Margin metric as Profit/Revenue.
If you decide to change how Revenue is calculated later on, you can
make changes to the Revenue metric; all metrics defined using the Revenue
metric, including Profit and Profit Margin, will be updated to reflect
the change.
You create base formulas using similar steps as you would use to create
any other metric. You can also convert a simple metric to a base formula. When creating metrics using the base metric, you include
the base formula as part of the metric formula. For steps to create and use a base formula,
see