MicroStrategy ONE
Stock
A Stock graph is designed to plot high, low, open, and close values. It displays these values over a chosen period of time. Therefore, Stock graphs are particularly useful in depicting data that often fluctuates, such as stock prices or inventory levels.
In a Stock graph, columns are used to represent different ranges of values, from low to high. The size of each column represents the difference between the high and low values.
Stock graphs typically consist of the following elements:
- High value: The high value is marked at the top of each column. This represents the highest value achieved during a certain period of time.
- Low value: The low value is marked at the bottom of each column. This represents the lowest value achieved during a certain period of time.
- Open value: The open value is marked as a tail on the left side of each column. This represents the value when it is first recorded. For example, for a daily stock price, the open value represents the price of the stock at the beginning of the day, just as the stock market opens.
- Close value: The close value is marked as a tail on the right side of each column. This represents the value when it is last recorded. For example, for a daily stock price, the close value represents the price of the stock when the stock market officially closes for the day.
Stock Graph Types
You can create several types of Stock graphs in MicroStrategy, including the following:
- Hi-Lo Stock graph
- Hi-Lo-Open Stock graph
- Hi-Lo-Open-Close Stock graph
Hi-Lo Stock Graph Example
One of the types of Stock graphs you can create in MicroStrategy is the Hi-Lo Stock graph. A Hi-Lo Stock graph allows you to view the range of a set of values between the highest and lowest values.
The following Hi-Lo graph displays a waterfall-style income statement for a company. This style of graph shows all the factors involved in the net income for a company. Thresholds are applied to the report to highlight income or revenue with green formatting, and to highlight costs or expenses with red formatting.
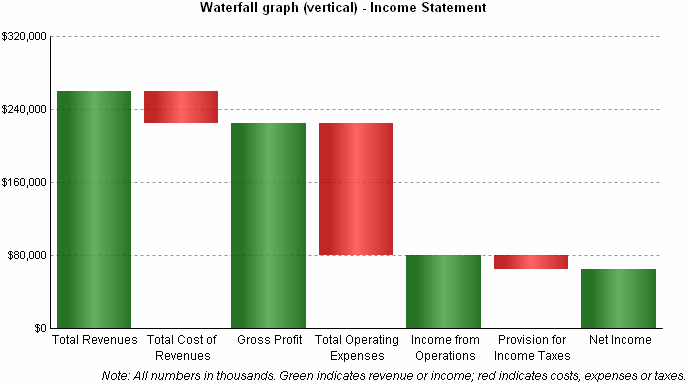
This graph report, named Waterfall graph (vertical) - Income Statement, is available in the MicroStrategy Tutorial project. In addition to providing an example of a Stock graph, it also provides an example of a Freeform SQL report. This report was created using MicroStrategy's Freeform SQL functionality to report on an operational data mart that stores income data. For information on using Freeform SQL, see Custom SQL Queries: Freeform SQL and Query Builder.
Hi-Lo-Open-Close Stock Graph Example
Another type of Stock graph that you can create in MicroStrategy is the Hi-Lo-Open-Close graph. In this type of graph, you can view high and low values, as well as opening and closing values, all in a single graph. The following Hi-Lo-Open-Close graph sample provides a look at the quarterly high, low, open, and close inventory numbers of a company. Open values are displayed as tails on the left side of each column and close values are represented by tails on the right side of each column.
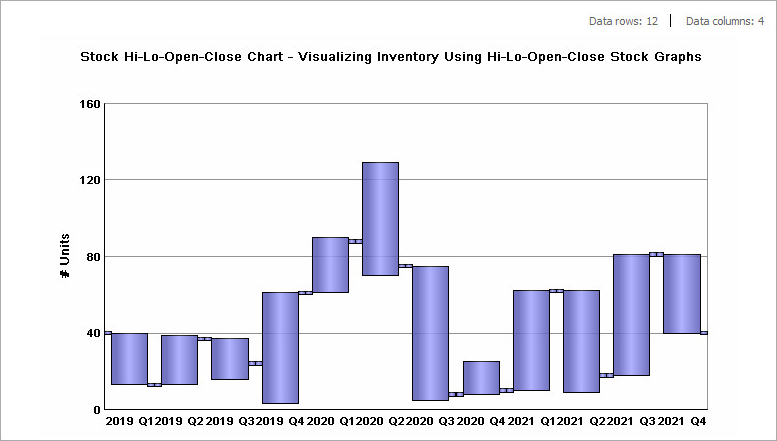
For example, at the beginning (open) of Q4 of 2019, there were 24 copies of the item "500 Best Vacation Home Plans," as shown by the tail on the left side of the column. The fewest items ever available (low) in the company's inventory during that quarter was three and the most items the company had (high) was 61. These high and low values are represented by the top and bottom of the column respectively. Additionally, the tail on the right side of the column shows that at the end of the quarter (close) there were 61 items, which is also equal to the high value for the quarter.
This graph report, named Stock Hi-Lo-Open-Close Chart - Visualizing Inventory Using Hi-Lo-Open-Close Stock Graphs, is available in the MicroStrategy Tutorial project.
Using Stock Graphs Effectively
- When you create any type of Stock graph, you must include the correct number of attributes and metrics, and arrange the columns of the graph's report in the proper order. This ensures the graph's columns are displayed as shown in the examples above.
- When you create a Hi-Lo Stock graph in MicroStrategy, you must include at least one attribute and two metrics in the graph report definition. For example, an attribute that displays the quarter, a maximum stock price metric, and a minimum stock price metric are used to display stock prices. If you do not include a sufficient number of attributes and metrics on the report, you cannot view the report as a Hi-Lo Stock graph.
- When you create a Hi-Lo-Open-Close Stock graph, you must use at least one attribute and four metrics in the graph report definition. For example, a Quarter attribute, maximum inventory metric, minimum inventory metric, opening inventory metric, and closing inventory metric are used in the Hi-Lo-Open-Close graph above. The Item attribute is also included in the Page-by for the graph report, allowing each page to display inventory values for an individual item.
- For stock graphs, arrange the report's metrics in the following order for the series of the graph:
Graph Type
First Metric
Second Metric
Third Metric
Fourth Metric
Hi-Lo Stock graph
High value
Low value
Not displayed on the graph
Not displayed on the graph
Hi-Lo-Open Stock graph
High value
Low value
Open value
Not displayed on the graph
Hi-Lo-Open-Close Stock graph
High value
Low value
Open value
Close value
- If you display the data labels for a stock graph, only a single value is displayed. You can select to display either the high, low, open, or close value as the data label for the stock graph. For Hi-Lo Stock graphs, you should select to display either the high or low data label, as open and close are not applicable. Similarly, for Hi-Lo-Open Stock graphs, you should only select to display either the high, low, or open data label, as close is not applicable.
- If you view a stock graph using MicroStrategy Web, all possible values for the graph can be displayed using tooltips. For steps to create tooltips in a graph, see Creating Tooltips in a Graph.
- If the open value tails of a Hi-Lo-Open-Close graph are not displayed when you create the graph in MicroStrategy, right-click the graph background and select Graph Options. The Graph Preferences dialog box opens. Expand the Layout category, then expand Hi-Lo options, and then select the Show Open check box. You can also select the Show Close check box to display the close values on your graph.
The options to display open and close values are available through drop-down lists in MicroStrategy Web.