MicroStrategy ONE
3D Surface
A 3D Surface graph is designed to display data points using shading, color, and multiple dimensions. It helps you analyze patterns, comparisons, and trends in data, and is especially useful to interpret the relationships between three different sets of data.
Graphs that contain large data sets are generally good candidates to be displayed as three-dimensional surfaces because 3D Surface graphs provide a third axis on which to visually display data. MicroStrategy allows you to choose several different styles of 3D Surface graphs to accommodate your graphing preferences.
3D Surface Graph Types
You can create several types of 3D Surface graphs in MicroStrategy, including the following:
- 3D Surface
- 3D Surface with Sides
- 3D Honeycomb Surface
3D Surface Graph with Sides Example
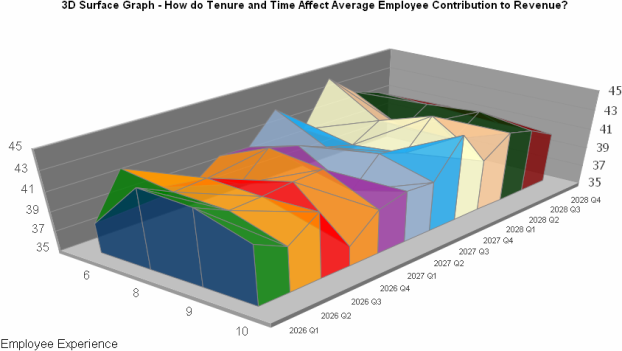
One of the types of 3D Surface graphs you can create in MicroStrategy is a 3D Surface Graph with Sides. The following graph highlights the type of data you can use to create a 3D Surface Graph with Sides. It also shows how you can analyze the data on the graph.
The example highlights the effect that time and employee tenure have on the average revenue contribution of each employee. Notice that the Y-axis, which represents average revenue per employee, appears on both the left and right side of the graph because of the graph's dimensionality.
The bottom-left side of the graph represents the number of years an employee worked for the company and the bottom-right side of the graph represents different quarters. Notice that the amount of generated revenue can differ depending on employee experience. For example, in 2026 Q1 (represented by the blue side on the far left of the graph), revenue contribution was lowest for employees with six years of experience. Revenue contribution was also relatively low for employees with ten years of experience. During the same quarter, employees with eight and nine years of experience contributed the most to revenue. Similar results are also apparent throughout future quarters. However, some quarters (2027 Q4 and 2028 Q2) show increases in revenue contribution by employees with six or ten years of experience.

Using 3D Surface Graphs Effectively
- To format the color of each category in a 3D Surface graph in MicroStrategy Developer, right-click the graph's background and select Graph Options. Within the Display category, from the Color Mode drop-down list, select Color by Categories. It is also helpful to set the risers to be colored according to their height. To do this, from the Color Mode drop-down list, select Exact Color By Height. Note that you can make only one selection at a time from the Color Mode drop-down list.
In MicroStrategy Web, you can access graph formatting options by selecting Graph on the Format menu. However, some graph formatting options, such as assigning the color of columns by category or height, are not available in Web.
- For information about the specific options for 3D Surface graphs in MicroStrategy, see the MicroStrategy Developer help.
