MicroStrategy ONE
Funnel
A Funnel graph provides another visually distinctive way of depicting report data. Funnel graphs are generally designed for conducting pipeline analyses for sales forecasts. They are also useful in illustrating the percent contribution of sales data, as they usually display data that adds up to 100%.
There is only one type of Funnel graph available in MicroStrategy.
Funnel Graph Example
The following Funnel graph below provides information about the sales contribution of different regions. Each funnel slice, with its own color, represents a different region, such as Mid-Atlantic. The size and location of each slice depicts how a region's sales contribution compares to the other regions' figures. For example, the graph shows that the Northeast region contributed 24.42% of the total sales, the most of any region.
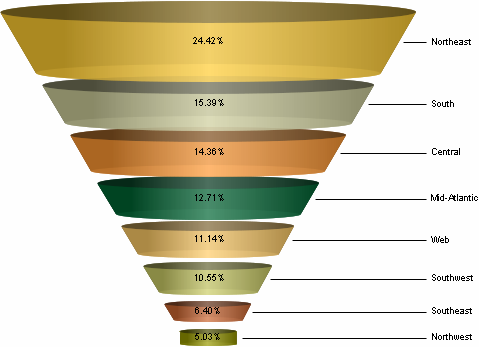
This graph report, named Funnel Graph - Sales Contribution By Region, is available in the MicroStrategy Tutorial project.
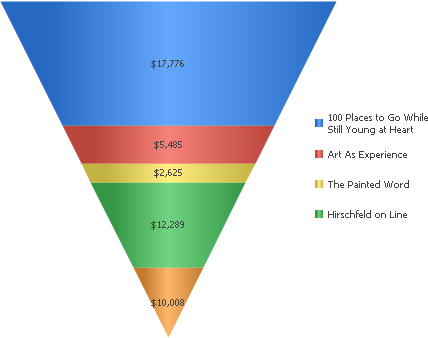
As demonstrated in the following graph, you can also use Funnel graphs to analyze simple sales and profit figures, in the same way you might use a Bar graph. The graph below displays the profit figures of five different books and shows how each book's profits compare with the others.
Using Funnel Graphs Effectively
- How a report is sorted determines what data is displayed at the top of the funnel. For example, in the first graph in this section, you can view the lowest sales contribution percentages at the top of the funnel instead of at the bottom by sorting the Percent to Total Over Rows (Revenue) metric column in ascending order.
- If your Funnel graph does not display all of its data on one page when you first build it, with the report in Graph or Grid Graph View, from the Graph menu, select Preferences. On the General category, adjust the Maximum number of series setting to reflect the number of report-level attribute elements that the Funnel graph is based on. For example, suppose a graph contains profit data for 20 different items and Item is the report-level attribute. In this case, you can adjust the Maximum number of series setting to 20 to display the 20 different items represented in the graph on one page.
In MicroStrategy Web, you can set the maximum number of series. From the Format menu, select Graph. Within the General category, in the Maximum area, in the Series field, type the maximum number of series to display for the graph.
For information about the specific options for Funnel graphs in MicroStrategy, see the MicroStrategy Developer help.