Strategy One
Display or Hide Grid Subtotals
You can display or hide subtotals in a grid.
- While viewing or editing the dashboard, select the grid visualization to add subtotals to.
- To display subtotals, right-click the metric and select Show Totals.
- To subtotal an attribute, right-click the attribute to its right, point to Show Totals, and select the function such as Total or Average. You can select multiple functions. Click OK.
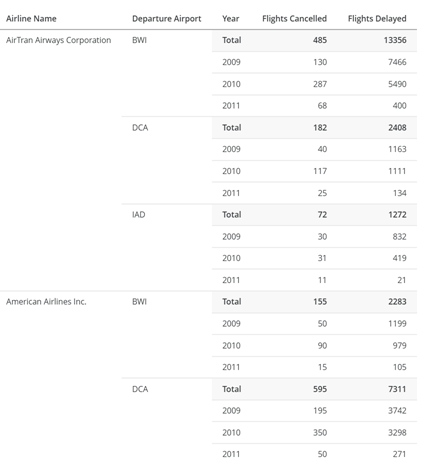
For example, the grid shown below displays the totals for each airline-airport combination. This was accomplished by right-clicking Year to subtotal. To display the totals for each airline, right-click Departure Airport. To display grand totals, right-click Airline Name.
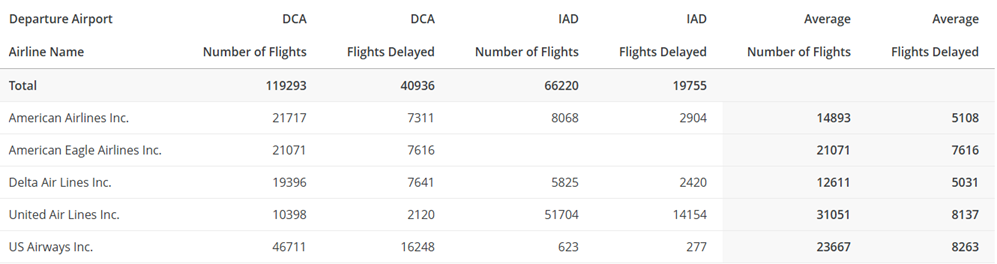
In a modern grid, you can total the rows and/or the columns. For example, the modern grid shown below displays the totals for Airline Name (rows) across the top of the grid. The average for Departure Airport (columns) is shown as a separate column set on the right.
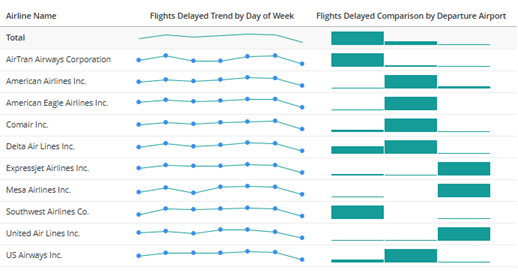
In a modern grid with microcharts, the total displays as the microchart. For example, the sparkline for Flights Delayed by Day of Week and the trend bars for Flights Delayed by Airport are totaled in the following grid:
-
By default, the totals for all metrics display at the top of the grid or modern grid. To move the subtotals to the bottom, right-click the subtotal label in the grid or modern grid, and select Move to Bottom.
- To move the subtotals back to the top, right-click the subtotal label and choose Move to Top.
-
By default, the total for all metrics in a modern grid's columns display in a column set on the right. To move the column set to the left, right-click the subtotal label in the modern grid and select Move to Left. The total column set displays between the attributes in the rows and the first column set.
-
To move the subtotals back to the right, right-click the subtotal label and choose Move to Right.
-
-
To hide all subtotals, right-click a metric and clear Show Totals.
If a custom subtotal has been defined and displayed by the dashboard author, it is hidden as well. You cannot redisplay the custom subtotal.
-
To hide a specific subtotal, right-click the subtotal label and select Remove.
You can hide a custom subtotal but you cannot redisplay it.
-
To hide multiple subtotals, right-click the attribute, point to Show Totals, and clear the check boxes for the specific functions. Click OK.