Strategy ONE
Designing and creating documents: An overview
First, you open a blank document and select a report to use as the document's dataset. A dataset is a set of data that can be displayed on a document, Report Services dashboard, or Visual Insight dashboard. A dataset can be a MicroStrategy report, a MicroStrategy Intelligent Cube, or data imported directly from an external data source. Reports include Freeform SQL reports, Query Builder reports, MDX cube reports, and reports that access Intelligent Cubes. Intelligent Cubes can be based on MicroStrategy data or imported data. The information in a dataset can include MicroStrategy objects such as attributes, custom groups, consolidations, and metrics.
If a report is used as a dataset, these dataset objects are all of the objects from the dataset report, regardless of whether they are displayed on the report. For example, if a metric is in the Report Objects but not displayed on the grid, that metric is listed as a dataset object. For background information about view reports, including the different methods to add them to a document, see Using a view report or base report as a dataset.
When you create a new document, you can select the report or Intelligent Cube to use as the dataset, or import the data. Once the document is created, you can:
-
Add another dataset to the document
-
Replace an existing dataset with another dataset
-
Replace all the datasets in the document with a single dataset
-
Remove a dataset from the document
For steps, see Adding, changing, or removing a dataset.
You can create a document with multiple datasets, and you can add more datasets after you create a document. One dataset must be defined as the grouping and sorting dataset; you can group and sort only by the objects on this dataset. For details on how multiple datasets join together in a document, see Working with multiple datasets. For instructions to change the grouping and sorting dataset, see Changing the grouping and sorting dataset for a document.
An Intelligent Cube is a multi-dimensional cube (sets of data) that allow you to use OLAP Services features on reports, as well as share sets of data among multiple reports and documents. You can use an Intelligent Cube as a dataset, allowing you to use one Intelligent Cube for many different documents, while reducing access to the data warehouse. For background information on using Intelligent Cubes as datasets, including how to add a report that uses an Intelligent Cube as a dataset, see Using Intelligent Cubes as datasets.
After you open a document and add one or more datasets to it, you add controls to the document. Controls are the objects that display the data, images, and shapes in a document. Controls are shown in the document's Layout area as you design the document. A control can be any of the following:
-
Text field, which displays text such as:
-
Data (attributes, consolidations, custom groups, and metrics) from the document's datasets. See Adding text and data to a document: Text fields, for examples and steps.
-
Static text for labels. See Adding a static text label to a document, for examples and steps.
-
Information about the document (such as page numbers) and the datasets (such as report names and filter information). See Displaying document and dataset information: Auto text codes, for examples and steps.
-
Metrics created within the document, which use the metrics on the datasets to obtain data not directly available from the datasets. These include derived metrics, calculated expressions, and summary metrics. For instance, a calculated expression combines metrics from different datasets. For more examples, and steps to create them, see Working with metrics in documents.
-
-
HTML container, which displays real-time information from the web. For steps to create HTML containers, and examples of how they can be used, see Displaying real-time web and other HTML content: HTML containers.
-
Line or Rectangle. For steps to create lines and rectangles, and examples of how they can be used, see Adding shapes and lines to a document.
-
Image. For steps to create images, including guidelines to ensure that the images are available as needed, see Inserting images in a document.
-
Grid/Graph, which displays data in the form of a standard MicroStrategy grid report or graph report. For steps to create reports and examples of how they can be used, see Displaying Reports in Documents: Grid/Graphs.
Creating a Table Control is reserved for MicroStrategy use.
Other types of controls, such as selectors and widgets, provide interactivity and visually intuitive graphic images for users. These controls are commonly used on dashboard-style documents which provide additional interactivity. These types of controls include:
-
Panel stack, which is a holder for a collection of panels, or layers of data, in a document. A user can navigate or flip through the panels in a panel stack; only one panel is displayed at a time.
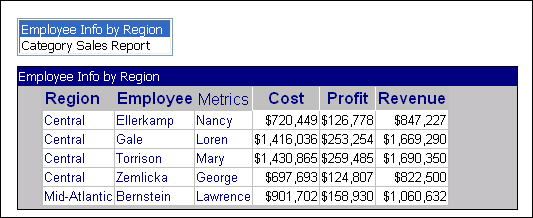
The document sample below shows a grid report, Employee Info By Region, on a panel in a panel stack.
-
Selector, which allows users to interact with the document by easily flipping through the panels in a panel stack or by displaying different attributes or metrics in a report.
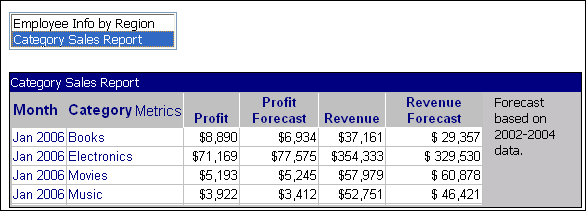
The selector in the document sample above is the list of reports at the left. When a user clicks Category Sales Report, that grid report on another panel in the panel stack is displayed, as shown below.
-
Widget, which allows users to visualize data in different ways than traditional reports displayed as grids or graphs do.
Each of these different kinds of controls is referred to as a control type.
Dragging and dropping a dataset object onto the Layout area of the Document Editor creates a control. If the dragged object is a dataset report, a Grid/Graph object is created; otherwise, a text field containing the dataset object is added to the Layout area. When the document is displayed, the Grid/Graph object is displayed like a MicroStrategy report; the text field displays the elements or values of the dataset object.
The document section where a control is placed determines not only the location of the values but also whether the control is repeated on subsequent pages of the document, and at what level the values are calculated. For example, some document sections, such as the Page Header or Page Footer, are appropriate for displaying page numbers because those sections are automatically repeated throughout the document. A metric placed in different document sections is calculated differently in each section. In the Detail section, the metric is calculated at the level of the attribute element, while the same metric placed in the Group Header section is calculated at the level of the group. This is described in more detail, including examples, in Metric calculation in document sections.
For details of each document section, including explanations of where they appear when the document is generated and the type of information they typically contain, see Understanding and working with document sections.
After you add controls, you can move and arrange them to determine how they appear when the document is viewed. For steps and examples of the various ways in which you can move and arrange controls, see Arranging controls on a document.
You can format the document as a whole, and also the separate controls that are included in the document. For information on the formatting available in documents, including steps and examples, see Formatting Documents.