Strategy ONE
Metric calculation in document sections
A metric is calculated differently depending on its location in a document. This section of the guide describes how metrics are calculated in each document section:
-
Calculating metrics at the group level: Group Headers and Group Footers
-
Calculating grand totals for metrics: header and footer sections
-
Calculating metrics at the level of a Grid/Graph and a group: Group Headers and Group Footers
When a metric is placed in a document section other than the Detail section, the metric is calculated using the dynamic aggregation specified in the metric definition. For details on how metrics are aggregated in documents, see Dynamic aggregation in documents.
For a description of the different types of metrics you can create in a document and steps to create them, see Creating metrics in documents.
Calculating metrics at the dataset level: Detail section
A metric placed in a text field in the Detail section is calculated at the level returned by the dataset that the metric comes from. The level of the dataset is defined by the attributes, consolidations, and custom groups on the dataset.
For example, a report contains the Region and Employee attributes, as well as the Revenue metric. A portion of this report is shown below.

This report is used as the dataset for a document. The Revenue metric is placed in a text field in the Detail section of the document. When the document is executed, the Revenue metric is calculated at the level of the dataset, which is Employee, as shown below. A portion of the document is shown below:

The numbers in the document match those calculated in the original report. A document would include additional information to give perspective to the numbers. This example shows that the numbers are calculated regardless of what is placed on the document.
To change the calculation of a metric, place it in a Grid/Graph or a text field in a different section of the document. For example, placing a metric in the Document Footer provides a grand total for the document.
Calculating metrics at the group level: Group Headers and Group Footers
A metric placed in a text field in a Group Header section or Group Footer section is calculated at the level of the group. Grouping allows you to specify the attribute, consolidation, or custom group to use to calculate the metric. (For an introduction to grouping data in a document, see Grouping and Sorting Records in a Document.)
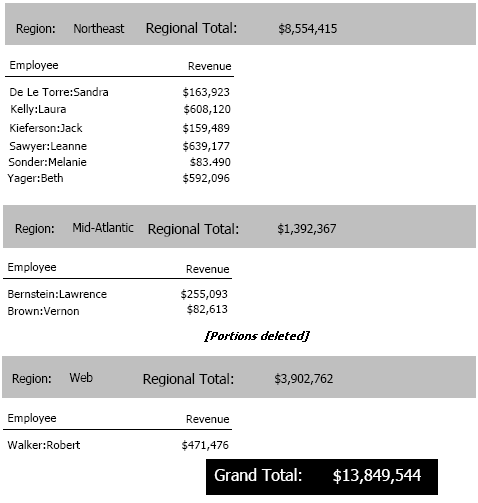
For example, a report contains the Region and Employee attributes and the Revenue metric. A portion of the report is displayed below. The report is subtotaled by Region for this example to help you compare metric values between the report and the document.

This report is used as the dataset for a document. The document is grouped by Region. The Revenue metric is placed in two text fields, one in the Group Header and the other in the Detail section. The region name is included in the Group Header, to differentiate between the groups.
In the executed document, in the Group Header, the Revenue metric is calculated at the level of the group (Region). The group's elements are the elements of the Region attribute. This provides regional totals. In the Detail section, the Revenue metric is calculated at the level of the dataset, which is Employee. A portion of the document is shown below:

The metric values match those calculated in the report.
The example above uses a metric in a text field. Metric values in a Grid/Graph in the Group Header or Group Footer are calculated at the level of both the group and the Grid/Graph. For details and an example, see Calculating metrics at the level of a Grid/Graph and a group: Group Headers and Group Footers.
The calculation of the group total is determined by the metric's definition, specifically by the dynamic aggregation function. For a description of how dynamic aggregation works in documents, see Dynamic aggregation in documents. Summary metrics explicitly set the aggregation function. For other metrics created directly in the document, the function specified in the definition is also used as the aggregation function, if the function is SUM, MIN, or MAX. For steps to create metrics in documents, see Creating metrics in documents.
Calculating grand totals for metrics: header and footer sections
A metric placed in a text field in any header or footer section other than a Group Header or Group Footer is calculated as a grand total, totaled across the entire dataset. These document sections include:
-
Layout Footer
Layout Headers and Layout Footers are only displayed in multi-layout documents. For descriptions and examples of these document sections, see Layout Header and Layout Footer. For background information about layouts in documents, including examples and steps, see Creating multi-layout documents.
For example, a report contains the Region and Call Center attributes, as well as the Revenue metric. A portion of this report is shown below. The report contains a grand total to help you compare metric values between the report and the document.

This report is used as a dataset for a document. The Revenue metric is placed in text fields in the Page Header, Document Header, and Detail Header. Because it is not placed in the Detail section, the Call Center revenue values are not displayed. Labels are included in each document section to indicate the different groups.
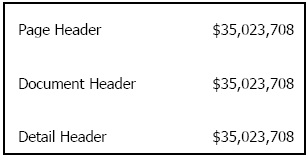
Notice that the metric values are the same for all the document sections, and they match the grand total calculated in the report. Which document section you place the metric in depends on where you want the information to appear, for instance, the top or bottom of each page (Page Header or Page Footer) or at the beginning or end of the document (Document Header or Document Footer).
The preceding example uses metrics in text fields. Metric values in a Grid/Graph in these document sections are calculated at the level of the Grid/Graph. For details and an example, see Calculating metrics at the level of a Grid/Graph and a group: Group Headers and Group Footers.
The calculation of grand totals is determined by the metric's definition, specifically by the dynamic aggregation function. For a description of how dynamic aggregation works in documents, see Dynamic aggregation in documents. Summary metrics explicitly set the aggregation function; this is their primary role. For other metrics created directly in the document, the function specified in the definition is also used as the aggregation function, if the function is SUM, MIN, or MAX. For steps to create metrics in documents, see Creating metrics in documents.
Calculating metrics at the level of a Grid/Graph
A metric placed in a Grid/Graph is calculated at the level defined by the attributes, consolidations, and custom groups on the Grid/Graph. (For background information on Grid/Graphs and steps to create them, see Displaying Reports in Documents: Grid/Graphs.)
If the Grid/Graph is placed in a Group Header or Group Footer, the level of the group is also included in the metric calculation, as described in more detail in Calculating metrics at the level of a Grid/Graph and a group: Group Headers and Group Footers.
A Grid/Graph cannot be placed in the Detail section. This is because the Grid/Graph would be repeated on each row since controls in the Detail section are repeated once per row of the dataset.
For example, a dataset contains the Region and Employee attributes, as well as the Revenue metric. A Grid/Graph containing all these objects is placed in the Detail Header section of the document. A second Grid/Graph, which contains only Region and Revenue, is placed in the Document Header. In the sample report shown below, all of the Grid/Graph containing Region only is shown, but only a portion of the Grid/Graph with both Region and Employee is included.

The metrics in the Grid/Graphs are calculated at the level of the attributes in the Grid/Graphs—Region only in the top Grid/Graph, Region and Employee in the bottom Grid/Graph. If a Grid/Graph contained only Employee and Revenue, and an employee generates revenue in two regions, the metric value displayed in each region would reflect the total revenue of the employee, for both regions.
If the Grid/Graph does not contain any objects other than the metric, the metric behaves as though it were in a text field in that document section. A metric in a text field in any header or footer section other than a Group Header or Group Footer is calculated as a grand total, totaled across the entire dataset. For example, if Region and Employee were removed from the Grid/Graphs in the previous example, both Grid/Graphs calculate a revenue grand total, as shown below:

The calculation of these grand totals is determined by the metric's definition, specifically by the dynamic aggregation function. For a description of how dynamic aggregation works in documents, see Dynamic aggregation in documents.
Calculating metrics at the level of a Grid/Graph and a group: Group Headers and Group Footers
A metric placed in a Grid/Graph is calculated at the level defined by the attributes, consolidations, and custom groups on the Grid/Graph, as described in Calculating metrics at the level of a Grid/Graph. When the Grid/Graph is placed in a Group Header or Group Footer, the level of the group is also included in the metric calculation, but only for those grouping fields that exist on the dataset to which the Grid/Graph belongs.
For example, a report contains the Region and Category attributes, as well as the Revenue metric. A portion of this report is shown below:

This report is used as the dataset for a document. The document is grouped by Region, and its Group Header contains a Grid/Graph with Category and Revenue. The Group Header also contains the Region name, to indicate the different groups. A portion of the document is shown below:

The revenue values are calculated at the level defined by the Grid/Graph (Category) but also at the group level (Region). Each Grid/Graph contains the revenue for its specific region and no others. The group (Region) exists on the dataset of the Grid/Graph.
In another example, a document contains two datasets:
-
Dataset 1 contains Region, Category, and Revenue. It is the grouping and sorting dataset. (For a description of the role of the grouping and sorting dataset in a document, see Using Intelligent Cubes as datasets.)
-
Dataset 2 contains Region, Call Center, and Revenue.
The document is grouped by Category (from Dataset 1). A Grid/Graph containing Call Center and Revenue (from Dataset 2) is placed on the Group Header. The Group Header also contains the Category name, to indicate the different groups. The Group Header is displayed horizontally, so that the Grid/Graphs are easier to compare. A portion of the document is shown below.

Notice that the revenue values are the same for each Call Center, regardless of which Category is displayed. The revenue values are calculated at the level defined by the Grid/Graph (Call Center) but not at the group level (Category). Each Grid/Graph contains the revenue for all categories. The group (Category) does not exist on the dataset of the Grid/Graph.
If the Grid/Graph does not contain any objects other than the metric, the metric behaves as though it were in a text field in the same document section. As with metrics in text fields in Group Headers and Group Footers, the calculation is determined by the metric's definition, specifically by the dynamic aggregation function. For a description of how dynamic aggregation works in documents, see Dynamic aggregation in documents.
Dynamic aggregation in documents
For background information on dynamic aggregation in metrics, see the In-memory Analytics Guide.
Dynamic aggregation is the rollup of metric values that occurs when a text field or a Grid/Graph containing a metric is placed in any document section other than the Detail section. The function used in this aggregation is defined in the metric definition, as described in the following points:
-
If the metric function is SUM, MIN, or MAX and the dynamic aggregation function is set to default, the document aggregates the metric using SUM, MIN, or MAX accordingly. If you do not want SUM, MIN, or MAX to be used as the dynamic aggregation, change the metric definition by specifying the new function to be used as the dynamic aggregation function.
-
If a metric function other than SUM, MIN, or MAX is used and the dynamic aggregation function is set to default, dynamic aggregation does not occur. Instead of a value, dashes (--) are displayed (unless you have changed the replacement text). To use a specific function, change the metric definition by specifying the function to use as the dynamic aggregation function.
Compound metrics follow the same rules for aggregation. If a compound metric does not use a SUM, MIN, or MAX function, and the dynamic aggregation function is set to default, a null value is generated when the compound metric is placed in any section other than the Detail section. To trigger dynamic aggregation, specify the function to use for calculation.
In the case of metrics created directly in the document (calculated expressions and derived metrics), the function specified in their definition is used as the aggregation function if the function is SUM, MIN, or MAX. For details on metrics created directly in a document, see Creating metrics in documents.
For steps to change the dynamic aggregation function, see the Dynamic Aggregation chapter of the In-memory Analytics Guide.
Calculating totals in documents
Totals reflect accumulations at a given level, and can be applied to any document. A total or subtotal is calculated differently depending on its location in the document.
The calculation of the total is determined by the default subtotal function that is defined in the metric's definition. To specify the function used to calculate a subtotal, create a summary metric (see Using a function to create a subtotal: Creating summary metrics). If a total does not aggregate the way that you want it or if it does not aggregate at all, see Dynamic aggregation in documents. To have grand totals calculated for the entire dataset, see Calculating grand totals for metrics: header and footer sections.
For example, the following document, which is shown in Design Mode, is grouped by Region. The same metric is placed in text fields in the Region Header, Detail, and Document Footer sections.

When the PDF is generated, the same metric returns different values in the different locations. The metric in the Detail section is revenue by employee; the metric in the Region Header is regional revenue; and the Document Footer calculates a revenue grand total for the entire document. These differences reflect the different locations in the document where the metric is placed.
The metric calculation for the totals is determined by the default subtotal specified in the metric definition. In this case, the Revenue metric uses SUM.
The following table describes where to place a metric in the document to calculate the metric at a specific level:
|
How the Metric is Totaled |
Where to Place the Metric to Achieve This Calculation |
|
Totaled at the level returned by the dataset |
In a text field in the Detail section |
|
Totaled at the level of the group |
In a text field in a Group Header/Footer |
|
Totaled across entire dataset |
In a text field in the Document Header/Footer or Page Header/Footer |
|
Totaled at the level defined by attributes, consolidations, or custom groups on the Grid/Graph, and at the level of the grouping section |
In a Grid/Graph control in a Group Header/Footer |
|
Totaled at the level defined by attributes, consolidations, or custom groups on the Grid/Graph |
In a Grid/Graph control in the Document Header/Footer or Page Header/Footer |
You can also display totals for groups and for selectors. For examples and steps to show totals for groups, see Showing totals for a group. For details to show totals for selector, see the Dashboards and Widgets Creation Guide.
To calculate a total on a document
-
In MicroStrategy Web, open the document in Design or Editable Mode.
-
In the document's Layout area, right-click the metric to be totaled and select Copy.
-
Right-click in the location where you want to place the metric and select Paste.
-
If you copy the metric to a Group Header or Footer, the metric subtotals at that level.
-
If you copy the metric to the Page Header or Footer, or the Document Header or Footer, a grand total for the metric is calculated.
For details of how a metric is totaled depending on the document section it is placed in, see Metric calculation in document sections.
-
Copying the metric from the Layout area also copies the metric's formatting. If you drag the metric from the Dataset Objects pane, the default formatting for the control is used (for details, see Defining default formatting for control types: control defaults).